What is the Dashboard panel and how does it work?
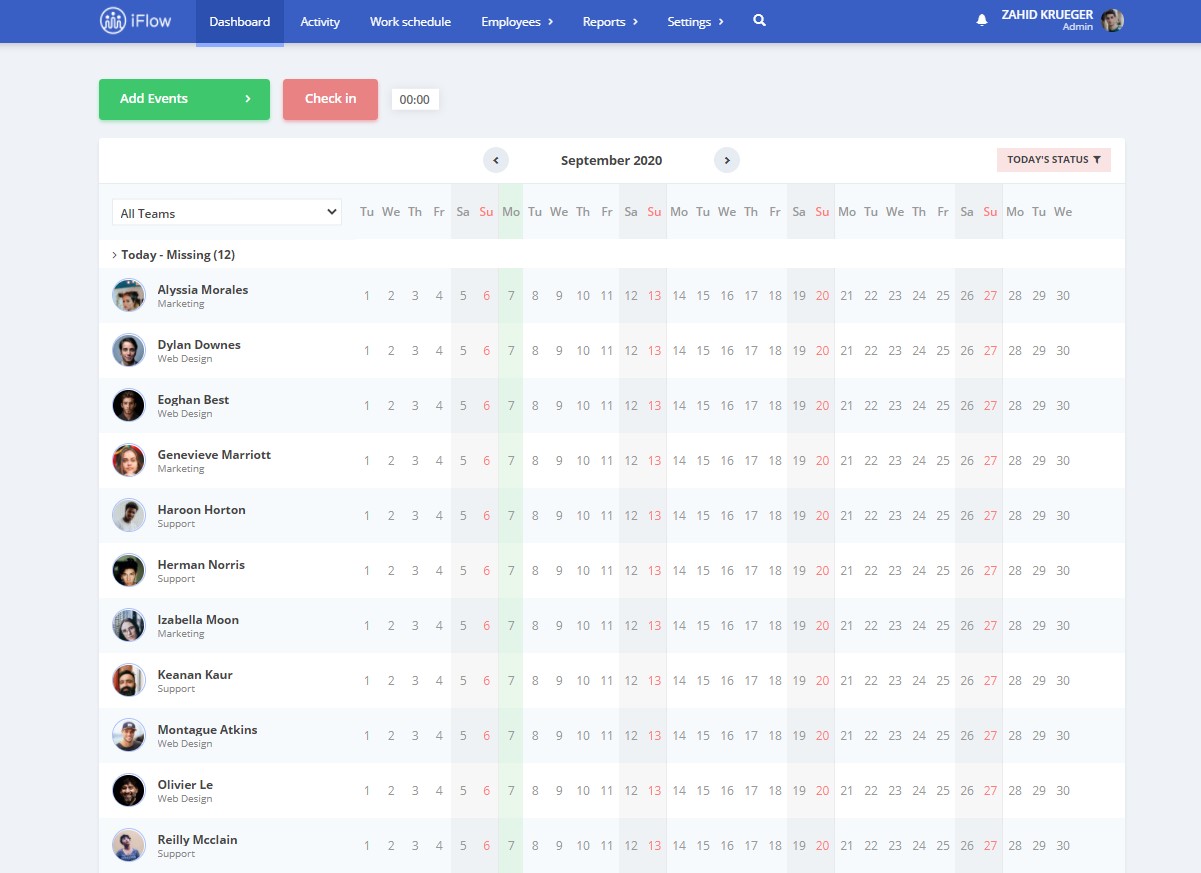
The Dashboard is the main panel of the iFlow app. This is the starting point when you are creating a new account or when you log in.
On this panel, you will see the whole month with all the added events.
What actions can you perform in this panel:
- Add events
- Add employees
- View events that are added (by you or your employees)
- Navigate to past or next months, using „<” and „>” from the middle of the panel
- View the legend of the available events
- Filter the panel by teams
- You can use Today’s status. More details about it here.
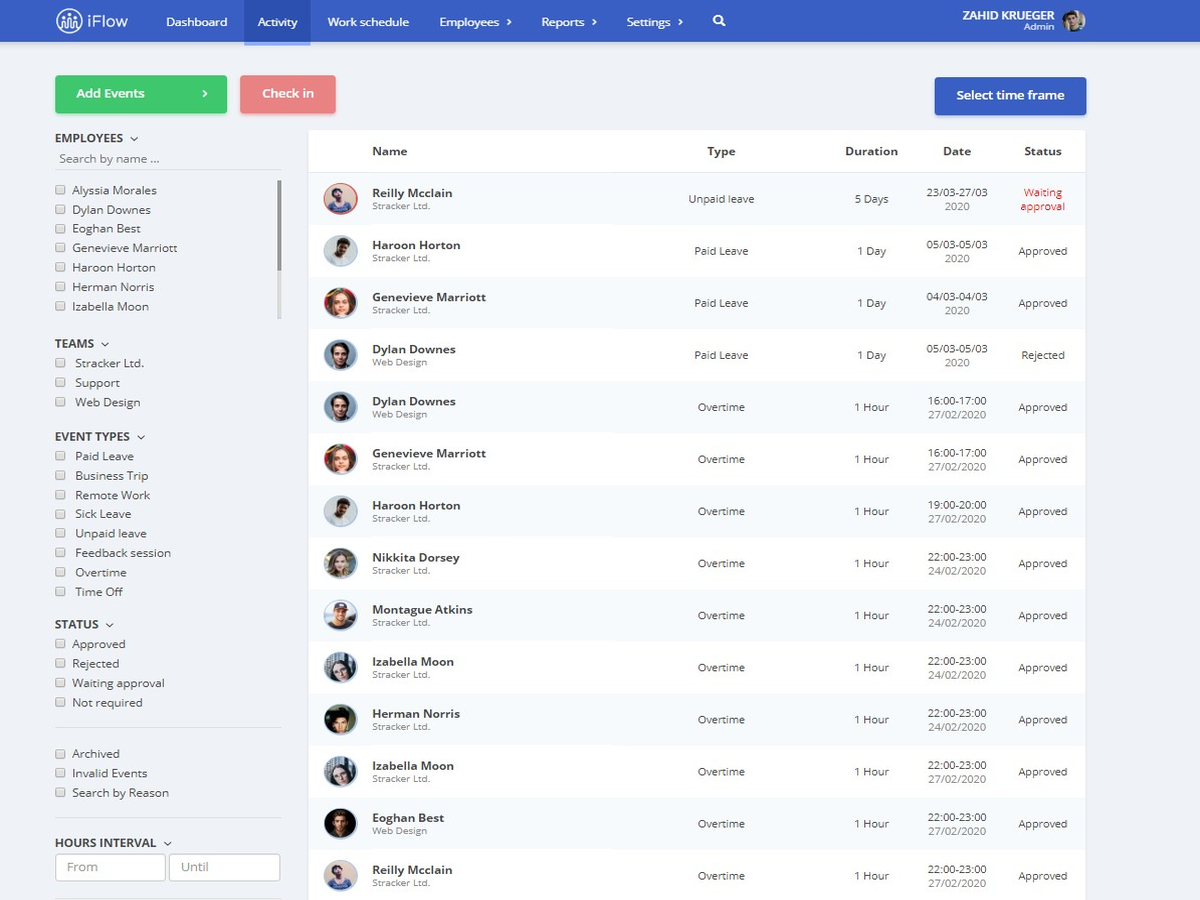
What is the Activity panel and how does it work?
This panel has 2 components: the activity table and the filter for it.
Below you can read the explanations for every component. You are allowed to make multiple selections.
The Activity table has 5 columns:
- Name – you will see the full name and the type of user
- Type – the type of event
- Duration – the time/date interval of the event
- Date – the day or days in which the event happens
- Status – the status of the event (approved, rejected, waiting approval or not required)
By selecting an event from the list you will be able to: Print the document (in the case of events that have requests), Edit, Delete, Approve or Reject.
Filter functions:
- Employees – the list with all the employees from which you can select one of them, or search him
- Teams – the list of all the teams, you can select a team by checking the box in front of the name
- Event types – a list with all the events, and you can select one of them (you will have listed only the event that you selected)
- Status – all the types of statuses, and you can select what you want to see (for example, you only want to see the events that are waiting approval)
- Archived – the list of deleted events
- Invalid events – events that are showing signs of an error
- Search by reason – search through the events by a certain reason
- Multiple selections – if you click on the profile picture of the employees you will notice you can select multiple events at once
- Select time frame – select the period in which you want to see the events
Example:
Do you want to see only the overtime hours of an employee, who is still waiting for approval, for the last 2 weeks of March 16-27.03.2020? You will need to check:
- Type of event: Overtime
- Select the employee
- Status: Waiting approval
- Select the time frame
You will now only see this exact information.
Keyword: general status, dashboard, activity, requests