How to access reports in iFlow
In the iFlow application, reports are located in the main menu, Reports, with the only exception being the reports available in the Request menu.
- From the main menu Reports
- Click on the report you want to

How to customize, download, and print reports
Open the required report and click on the Settings button. Check the box corresponding to the value you want to display, and Uncheck the box for the value you do not want to display.
Click the Print button to print the report directly, and click the Download button to save the report to your device.
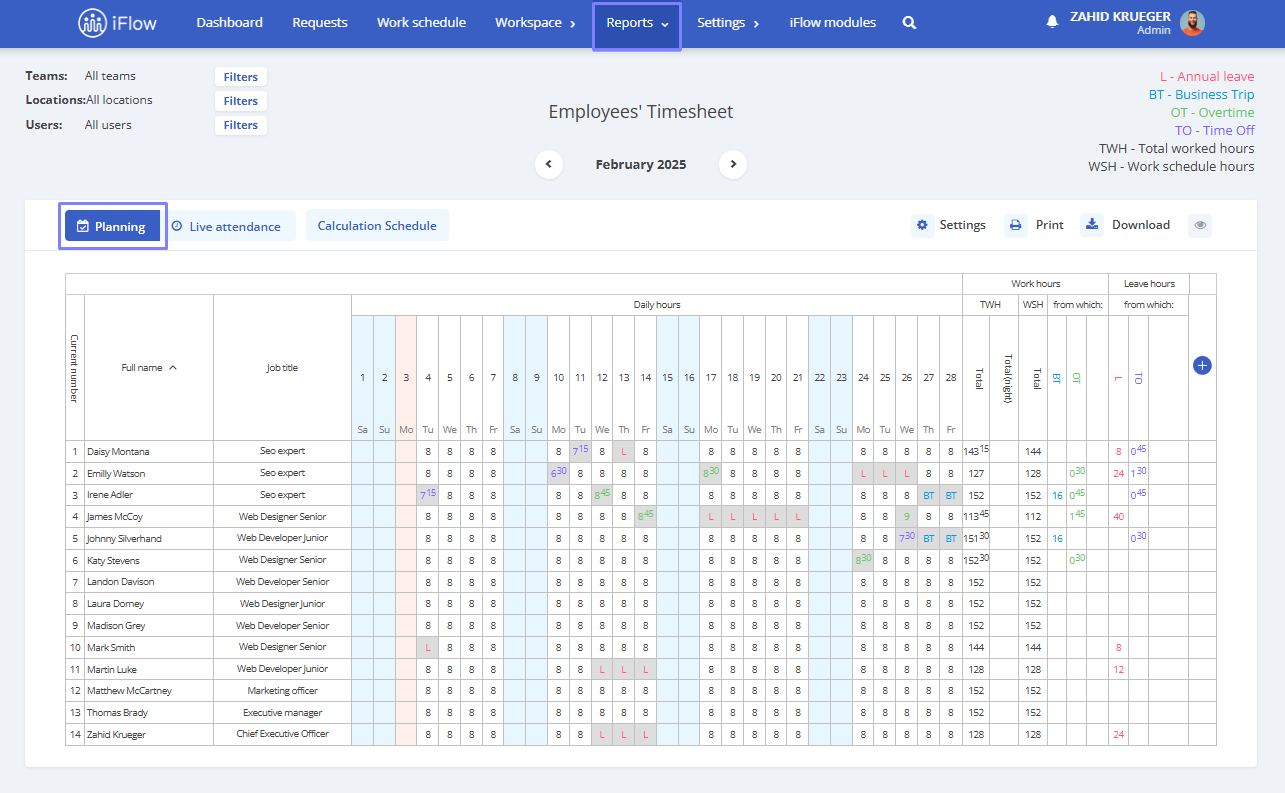
Timesheet report
The collective attendance sheet in iFlow is automatically filled out using Planning and Live attendance.
Timesheet – Planning
The Planning section displays employees’ working hours based on the work schedule planned at the company level.
Updates are made based on added events; each event is shown with its corresponding symbol. If an event is not approved, the cells corresponding to its time interval will be marked with a warning symbol. This symbol includes a link to the respective event for easy review.
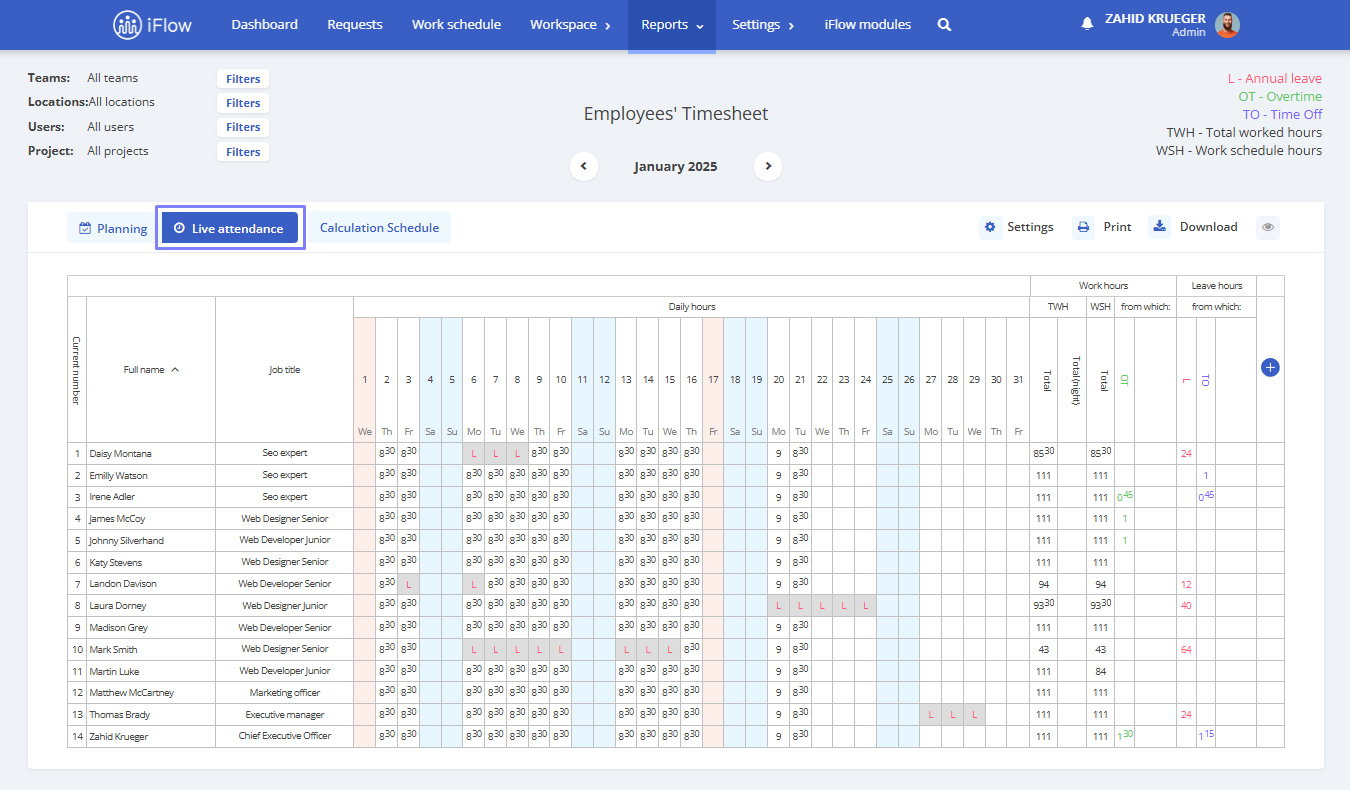
Timesheet – Live Attendance
The Live attendance section displays employees’ working hours based on the time registration using clock-in/clock-out buttons on a phone, PC, or RFID cards.
Updates are made based on added events, and each event is shown with its corresponding symbol. If an event is not approved, the cells corresponding to its time interval will be marked with a warning symbol. This symbol includes a link to the respective event for easy review.
Customizing the timesheet report
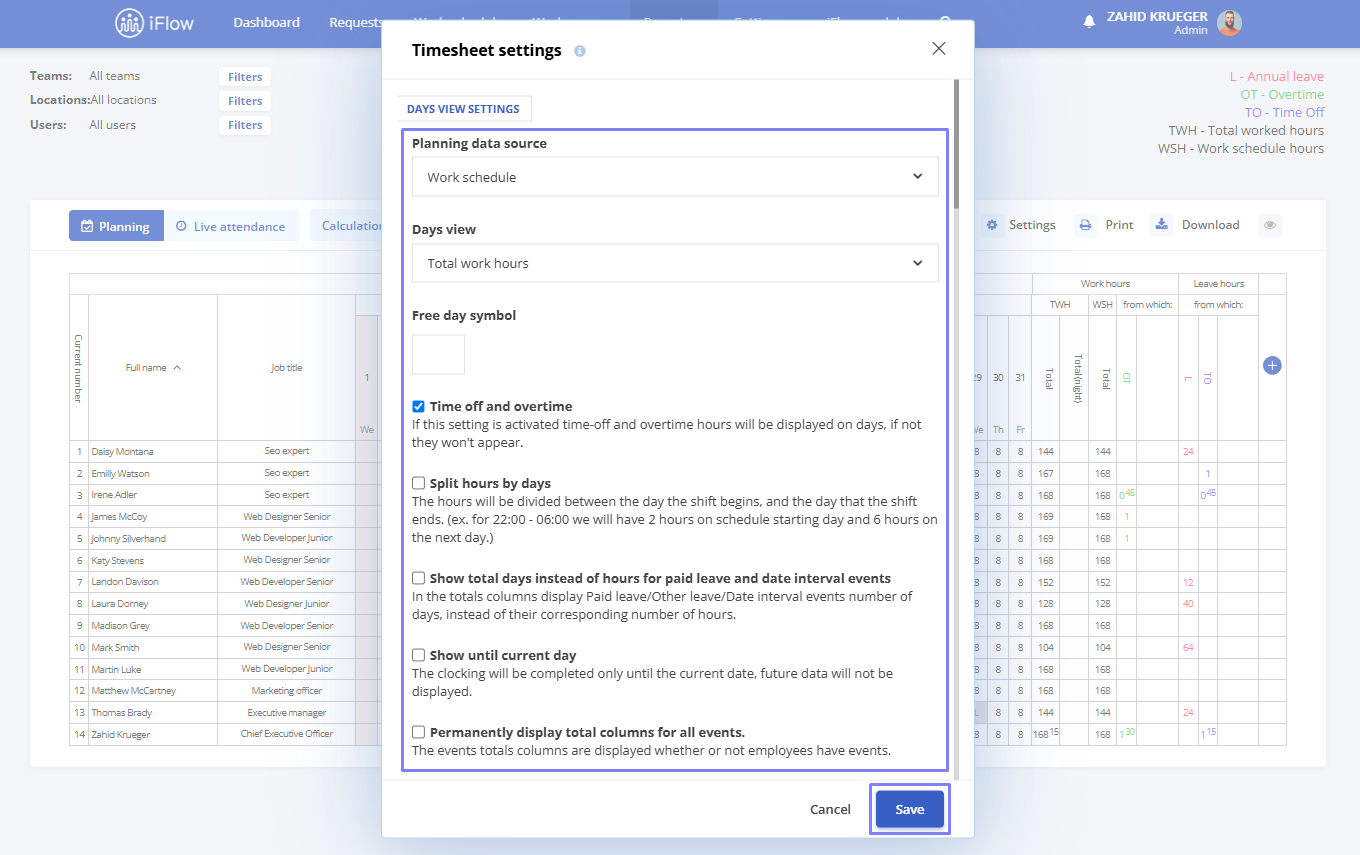
Planning data source
In this section, you can choose how the timesheet is generated. The data source options include:
- Work schedule – the timesheet will be generated based on the planned work schedule
- Work schedule + overtime – the timesheet will be calculated based on the work schedule, with overtime calculated according to the monthly workload
- Predefined shifts – the timesheet will be generated based on the predefined work shifts, with symbols displayed instead of numbers for shifts
Days view
- Total work hours – displays the total hours worked by employees per day
- Check-in/out hours – displays only arrival and departure times per day
- Check-in/out hours and Total work hours – displays both hours worked and arrival/departure times per day
Additional display settings by days
- Free day symbol – you can set a specific symbol for days without a work schedule (e.g., holidays or days off)
- Time off and overtime – if this box is checked, overtime and appointments will be displayed in the timesheet
- Split hours by days – hours spanning across days will be divided between the start and end days of the work schedule (Example: 22:00 – 06:00 will be split into 2 hours for the start day and 6 hours for the end day)
- Show total days instead of hours for paid leave and date interval events – in the columns with totals for events like Paid Leave/Sick Leave/Day Interval, the number of days will be displayed instead of the hours corresponding to those days
- Show until current day – the timesheet will only be completed up to the current date; no future days will be displayed
- Permanently display total columns for all events – total columns for events will be displayed regardless of whether employees have events or not
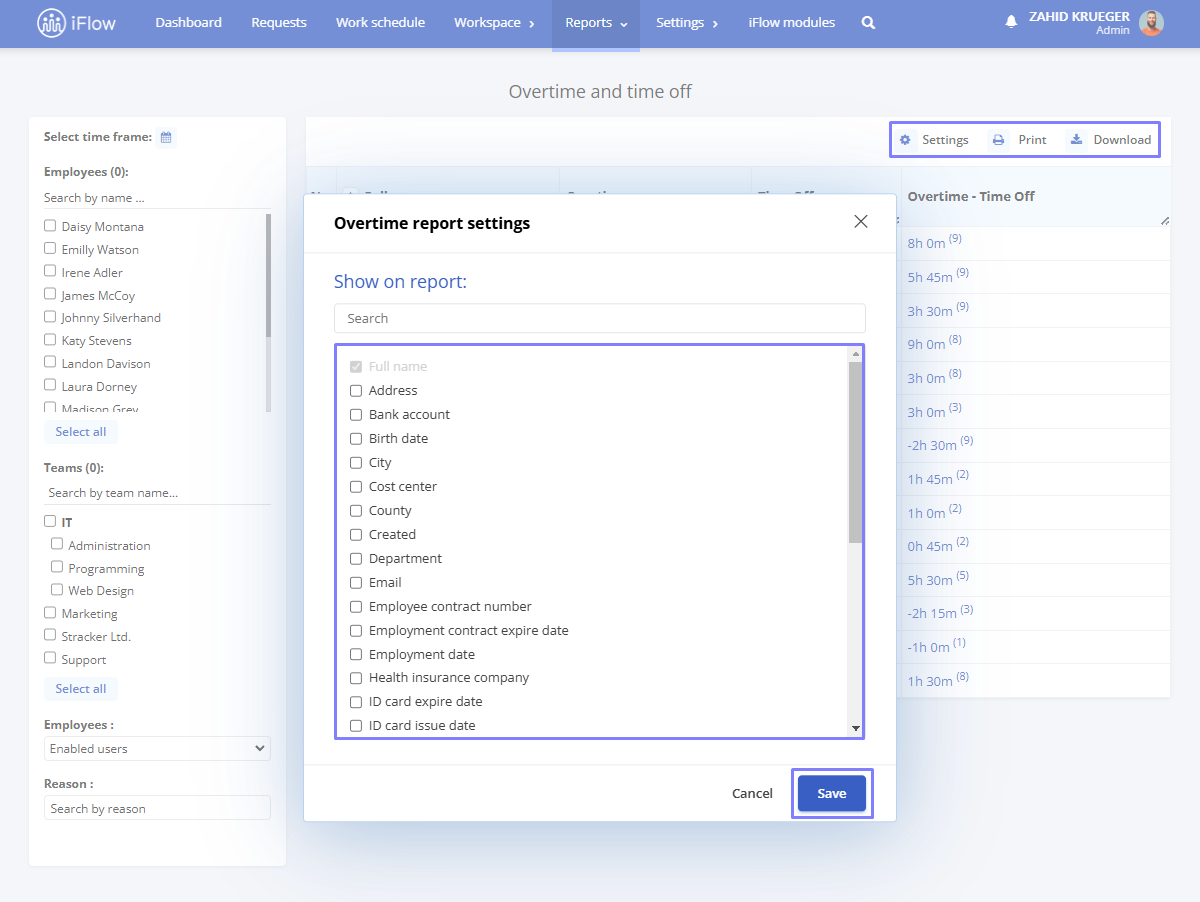
Show on report
In this section, you can choose additional values to be displayed in the timesheet report, such as:
- Address
- Bank account
- Birth date
- City
- Cost center
- County
- Department
- The employment contract expiration date
- Employment contract number
- Employment date
- Health insurance company
- ID card expire date
- ID card issue date
- ID card issued by
- ID card number
- Internal number
- Job title
- Phone number
- RFID tag
- RFID tag 2
- Section
- Social security number
- Team
- Team leader
- Workload
To display any of these details in the timesheet, simply check the box next to the value and click Save.
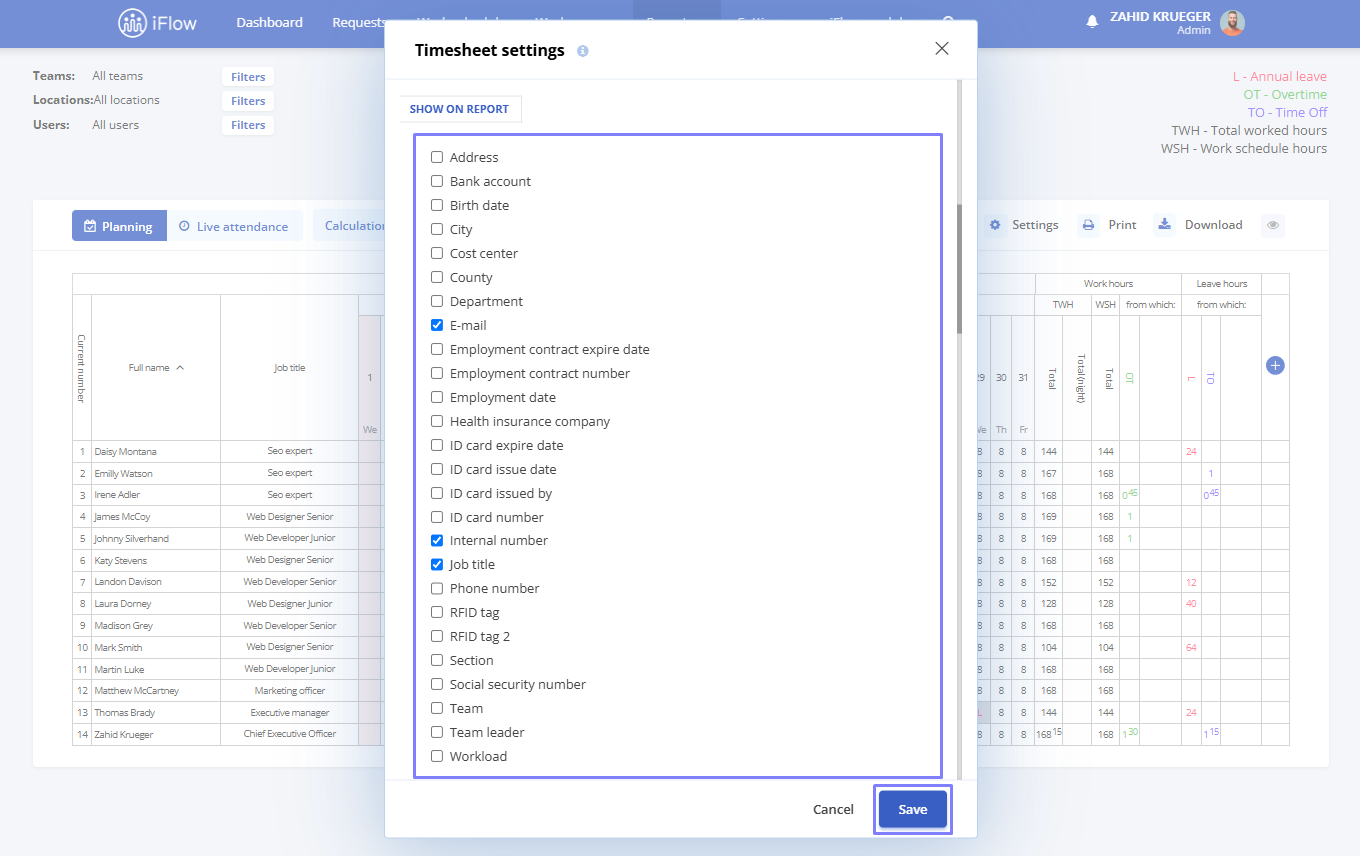
Example:
If you want to display the internal number and the job title in the timesheet in addition to the employee’s name, check the boxes next to Internal numer or Job title, then click Save.
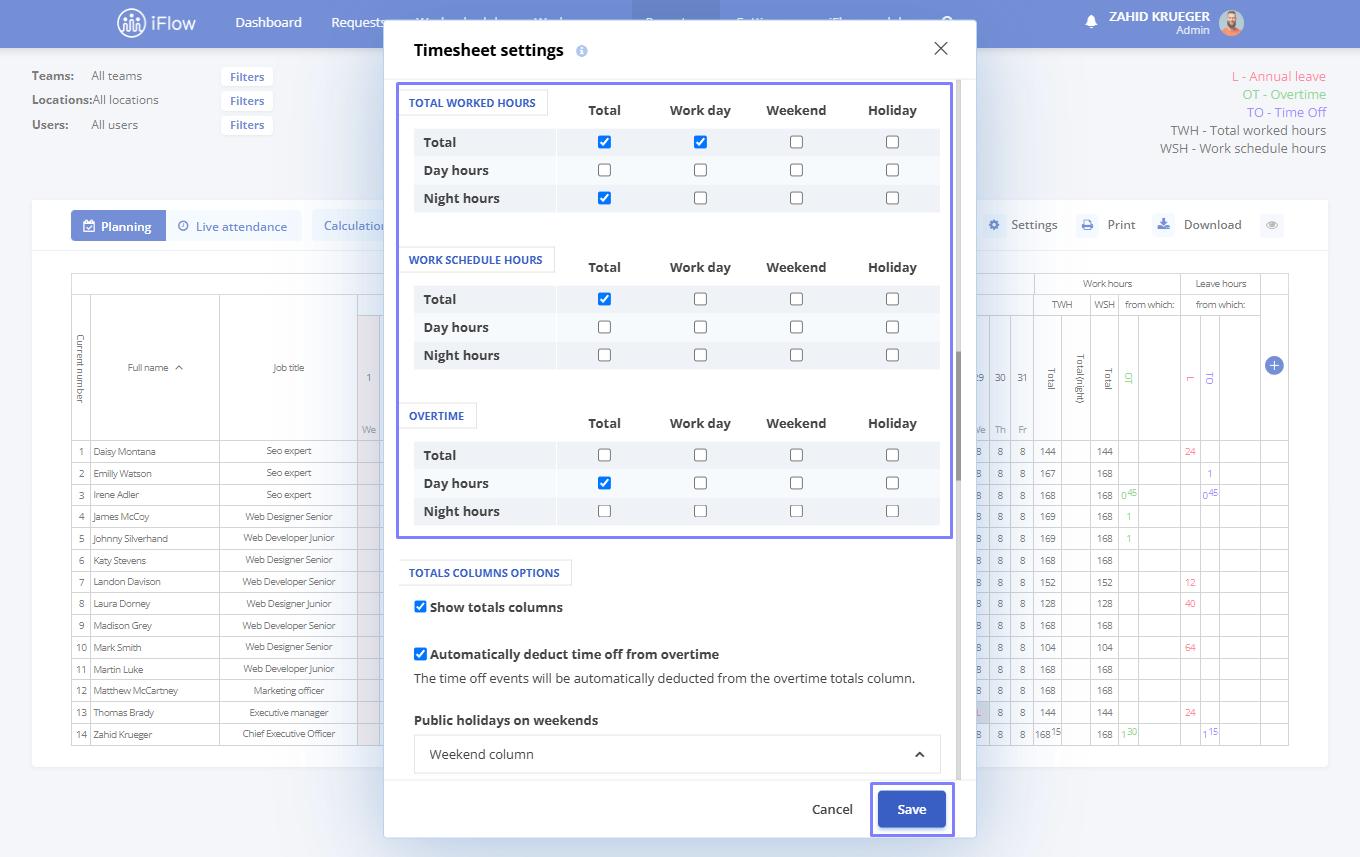
Total worked/schedule/overtime hours
This section of the Settings — Timesheet menu represents the total hours worked by an employee, including time off and regular hours. You can make multiple selections based on what you want to display in the timesheet.
Below, you will find explanations for the selections as a result of the intersections between rows and columns:
Total (across the entire 24-hour period):
- Row Total + Column Total = Total hours (represents the total hours worked)
- Row Total + Column Working Day = Total hours working day (represents the total hours worked on a working day)
- Row Total + Column Weekend = Total hours weekend (represents the total hours worked on the weekend)
- Row Total + Column Holiday = Total hours holiday (represents the total hours worked on a holiday)
Day Shift (06:00 – 22:00):
- Row Day Hours + Column Total = Total hours (represents the total hours worked during the day)
- Row Day Hours + Column Working Day = Total working hours (represents the total hours worked during the day on a working day)
- Row Day Hours + Column Weekend = Total weekend hours (represents the total hours worked during the day on the weekend)
- Row Day Hours + Column Holidays = Total holiday hours (represents the total hours worked during the day on a holiday)
Night Shift (22:00 – 06:00):
- Row Night Hours + Column Total = Total night hours (represents the total hours worked at night)
- Row Night Hours + Column Working Day = Total working night hours (represents the total hours worked at night on a working day)
- Row Night Hours + Column Weekend = Total weekend night hours (represents the total hours worked at night on the weekend)
- Row Night Hours + Column Holiday = Total holiday night hours (represents the total hours worked at night on a holiday)
Example:
If you want the timesheet to show: the total of all worked hours, the hours an employee worked at night on weekends, and the hours worked during the day on public holidays, you will make the following selections:
- For the total worked hours, select the box at the intersection of the Total row and Total column
- For the hours worked at night on weekends, select the box at the intersection of the Night hours row and Weekend column
- For the hours worked during the day on public holidays, select the box at the intersection of the Day hours row and Holidays column
OR
If an employee has 2 hours of overtime and 1 hour of time off, the timesheet will display 1 hour of overtime.
Total columns options
To display total columns in the report, check the box next to Show totals columns.
For public holidays on weekends:
- Both columns – Added to both columns
- Weekend column – Added only to the weekend column
- Public holidays column – Added only to the public holidays column
- Excluded – Excluded from all columns
For public holidays on weekdays:
- Both columns – Added to both columns
- Week days column – Added only to the week days column
- Public holidays column – Added only to the public holidays column
- Excluded – Excluded from all columns
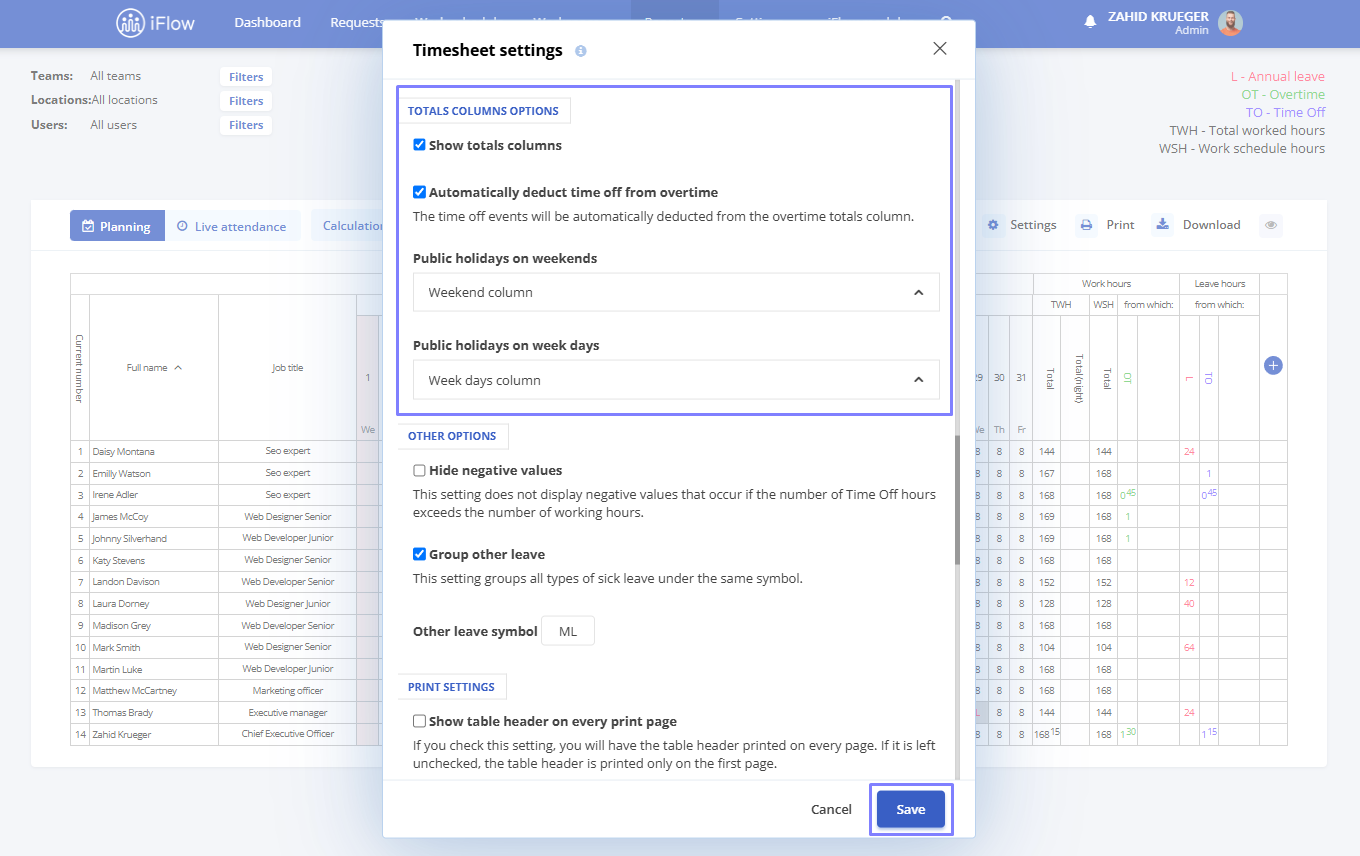
Other options
In this section, you will find two settings: one for displaying negative values in the timesheet and one for medical leave, where you can select a Symbol to be displayed on all medical leaves.
As its name suggests, the Hide negative values option will prevent negative values from being displayed in the timesheet report when checked.
The Group other leave option helps when you don’t want medical leaves displayed with different symbols in the timesheet. Thus, the legend is shortened, and all medical leaves will be displayed with your chosen symbol.
Attention!
The Group other leave settings will not affect compensation codes; it only influences the display in the timesheet. These are added to the application based on the compensation code, and requests and certificates are filled out with that code.
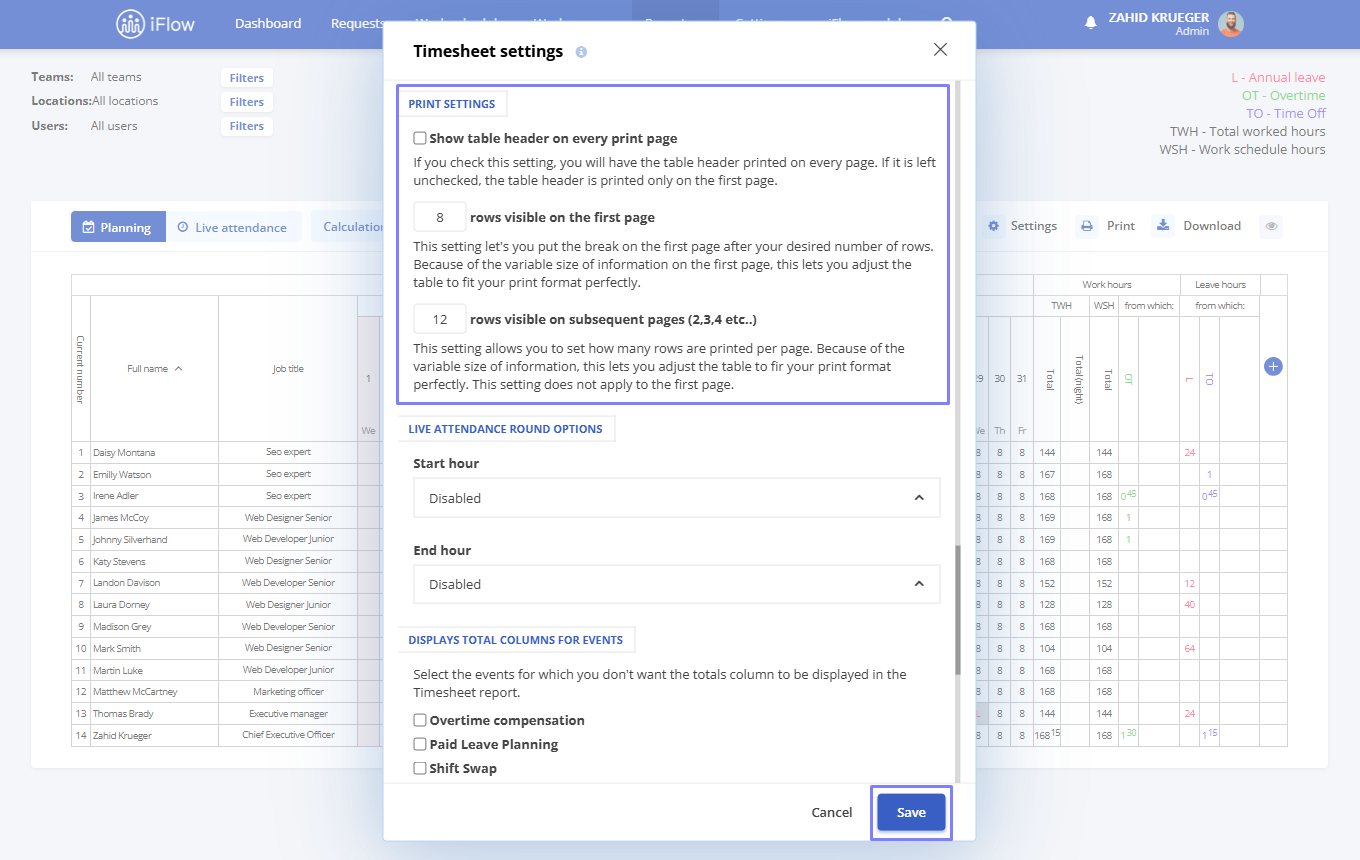
Print settings
Here, you can select the settings for printing the timesheet:
- Show table header on every print page – If you check this setting, the table header will be printed on every page. The table header will only be printed on the first page if left unchecked
- Number of rows visible on the first page – This setting allows you to insert a break on the first page after the desired number of rows. The variable information size on the first page helps you adjust the table to fit the necessary print format perfectly
- Number of rows visible on subsequent pages– This setting allows you to choose how many rows are printed on each page
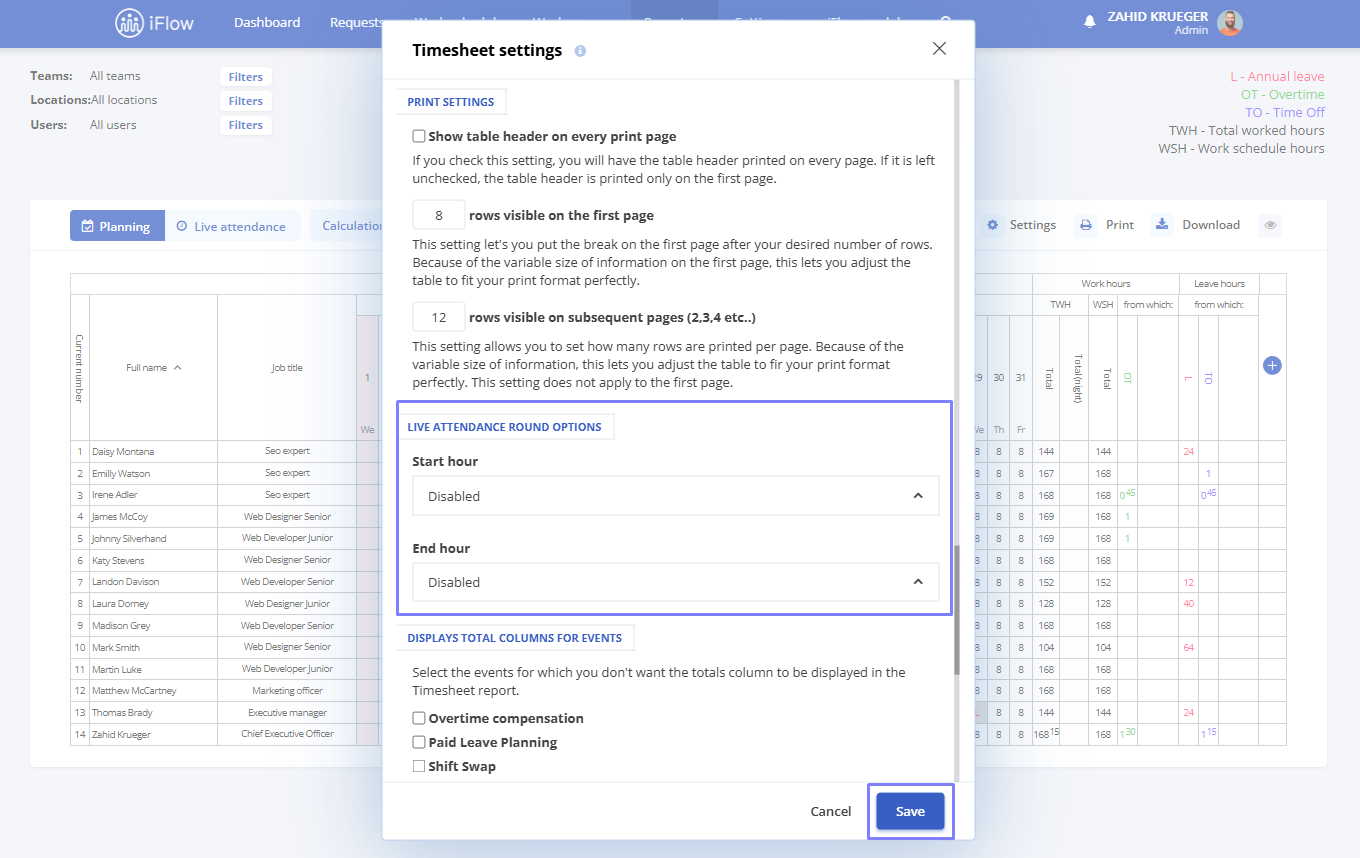
Live attendance round options
This setting is intended for users who use live attendance. You can decide whether start or end times are rounded up or down, with rounding occurring in 30 minute increments.
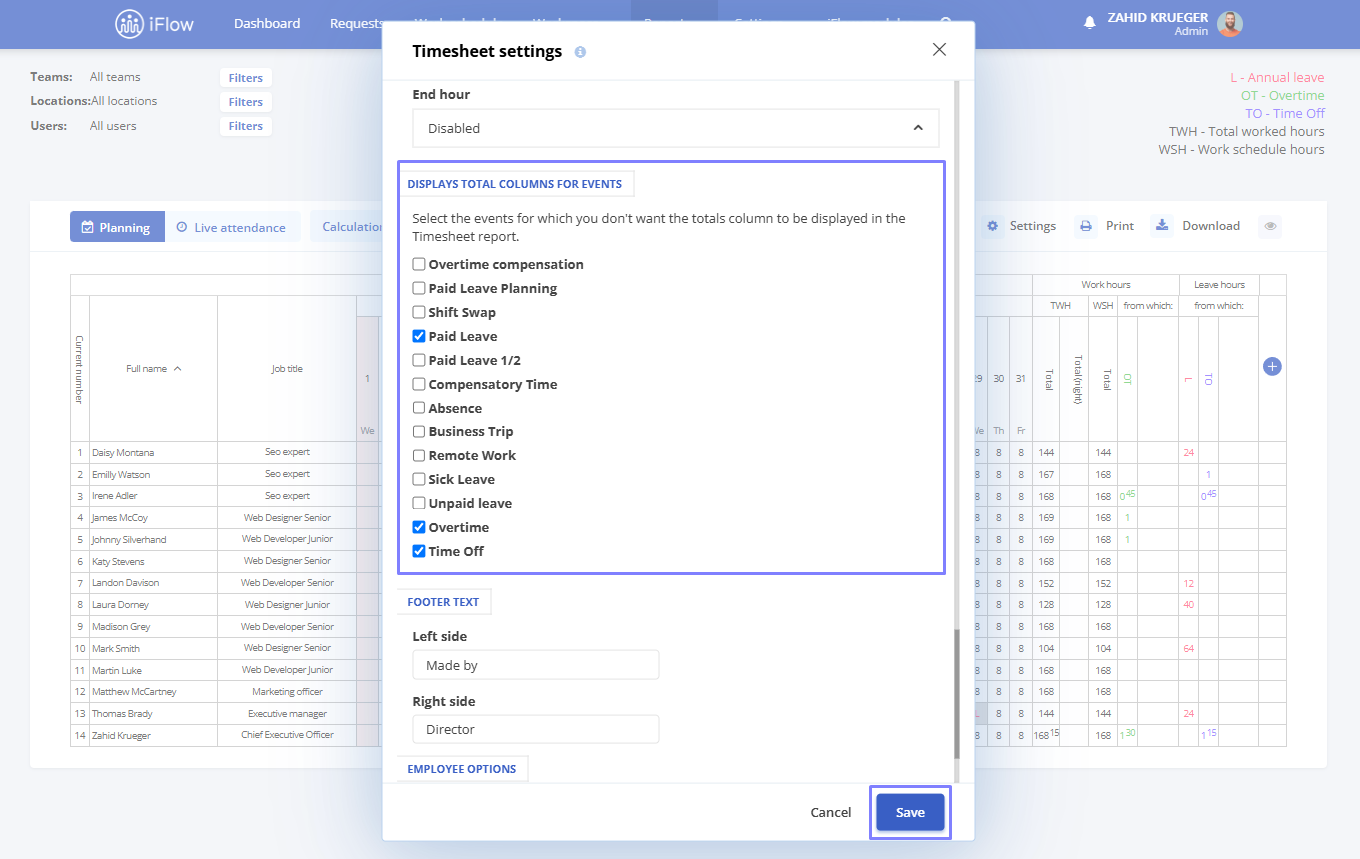
Display total columns for events
Here, you have a column for totals for each event, which is calculated automatically. You can select events for which you do not want the total column to be displayed in the Timesheet report, and you can choose events available at the company level.
All you need to do to exclude one from the report is uncheck the box next to it.
Footer text
In this section, you can edit the footer text of the downloaded report.
You have two custom text options that will appear on the right and left sides of the table.
Employee options
In this section, you can check to include suspended employees in the timesheet.
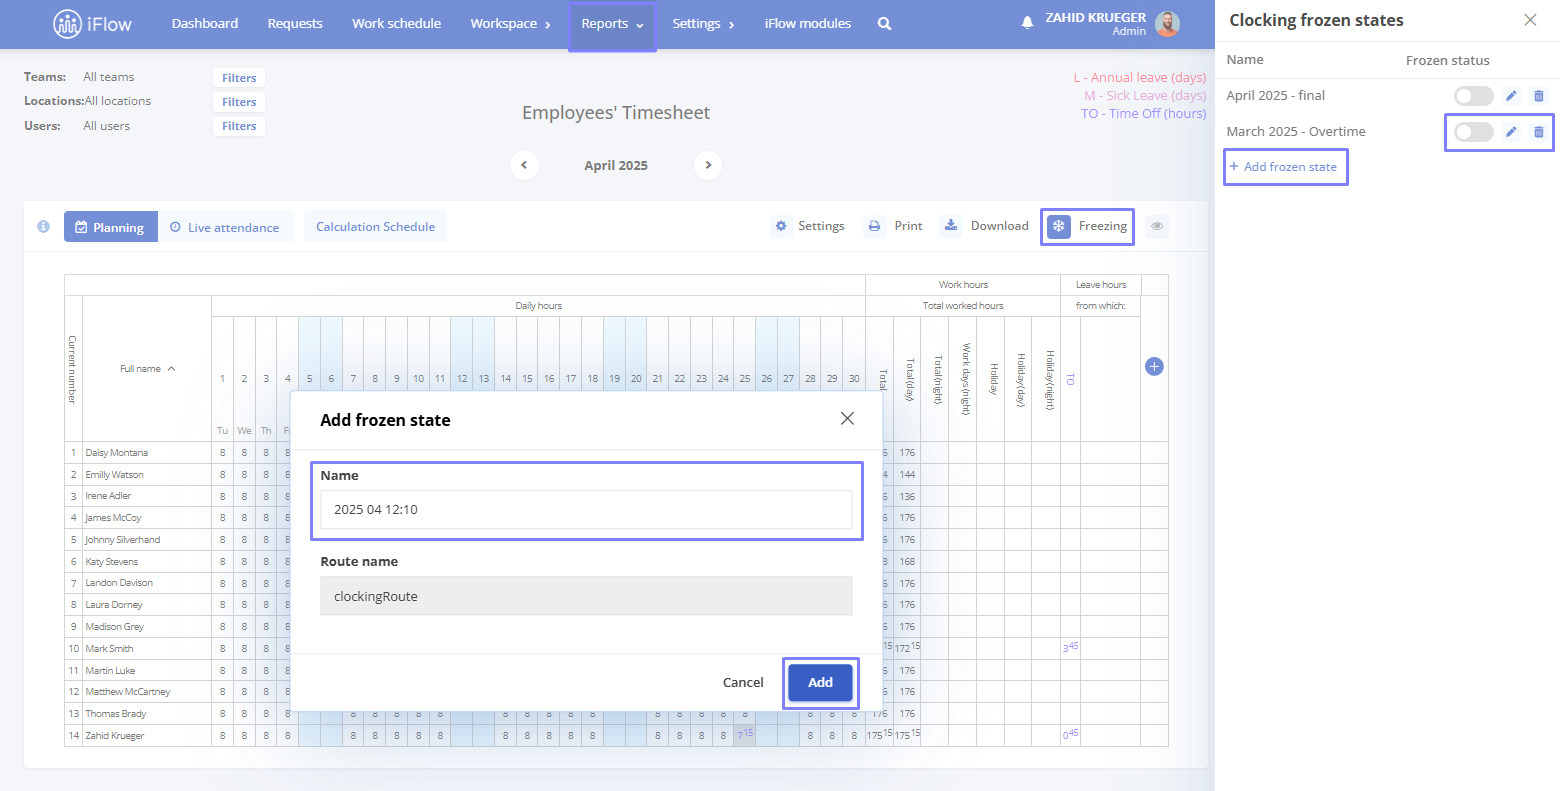
Timesheet freezing
You will find the Freezing button on the right side of the timesheet report.
By freezing the timesheet month, you save a fixed version of the data for a specific month – a state of the timesheet that can be accessed later for review or comparison.
This functionality is helpful for:
- Archiving a closed month
- Maintaining a clear history
- Checking for any changes made after the initial state
How to freeze a timesheet state:
- Click on the Freezing button in the timesheet report
- A panel will open on the right side
- Click on Add frozen state
- Enter a meaningful name for this state
- Click on the Add button to save the frozen timesheet state
- If you want to view a previously frozen report, click on the Freezing button and select the desired report from the list
Managing frozen states:
- You can create multiple frozen states, depending on your needs
- After saving, you can edit the name of the state using the Edit button
- The history is automatically saved: who added the state and when
- If necessary, you can delete a frozen state using the Delete button
Food coupons
How the report is completed
The Food coupons report is completed based on the allocated work schedule and employee events.
The work schedule defines the days, so employees without a set schedule will not have Food coupons. The Paid leave event is automatically subtracted from the total number of vouchers based on the number of days it applies to.
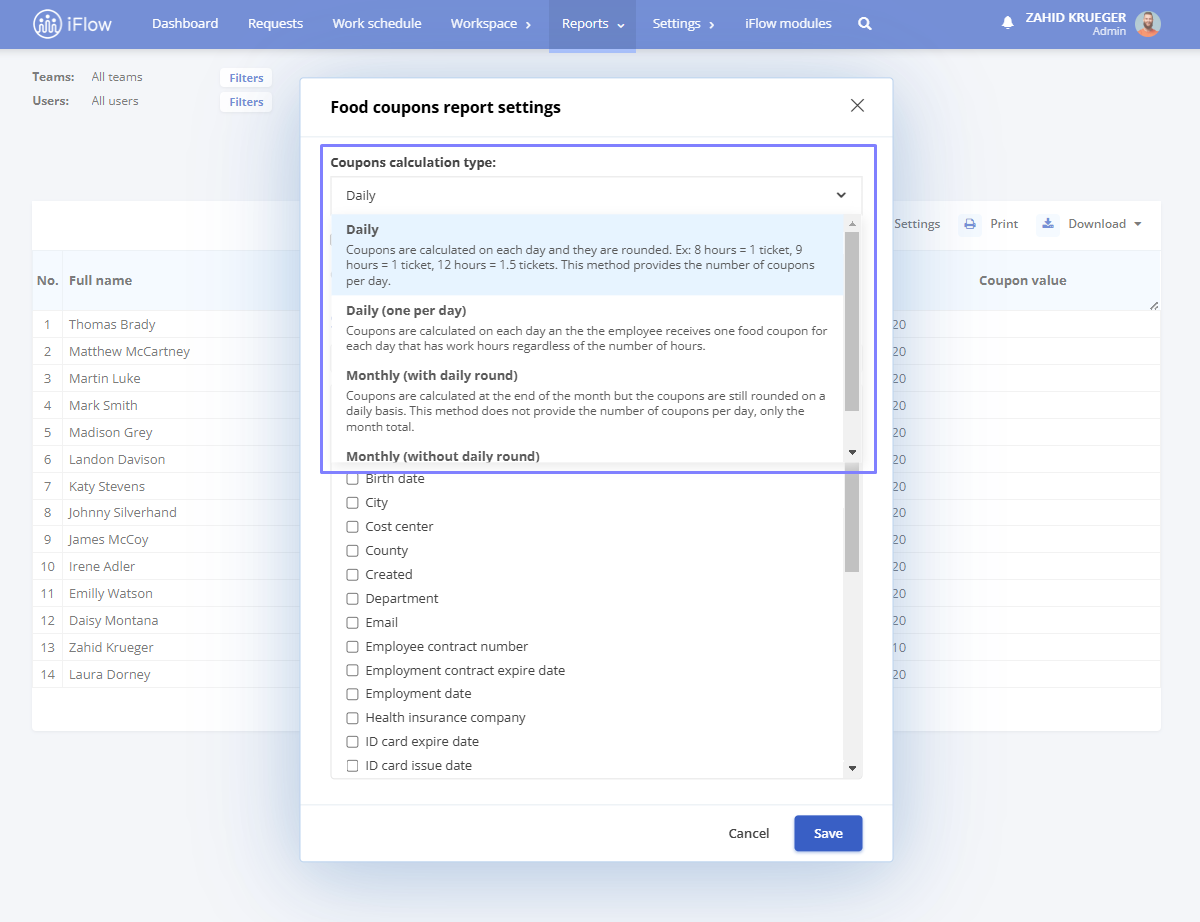
Food coupons calculation methods
- Daily – Coupons are calculated for each worked day, with the value rounded accordingly. For example, 8 hours = 1 coupon, 9 hours = 1 coupon, and 12 hours = 1.5 coupons. This calculation method determines the number of coupons granted daily
- Daily (one per day) – The employee receives a single food coupon per day, regardless of the number of hours worked, as long as they have worked that day
- Monthly (with daily rounding) – Coupons are calculated at the end of the month, but daily rounding is applied. Although Coupons are accumulated monthly, they are determined based on a daily calculation
- Monthly (without daily rounding) – The total number of coupons is determined at the end of the month without applying daily rounding. In this case, the number of coupons per day is not displayed, only the total monthly amount
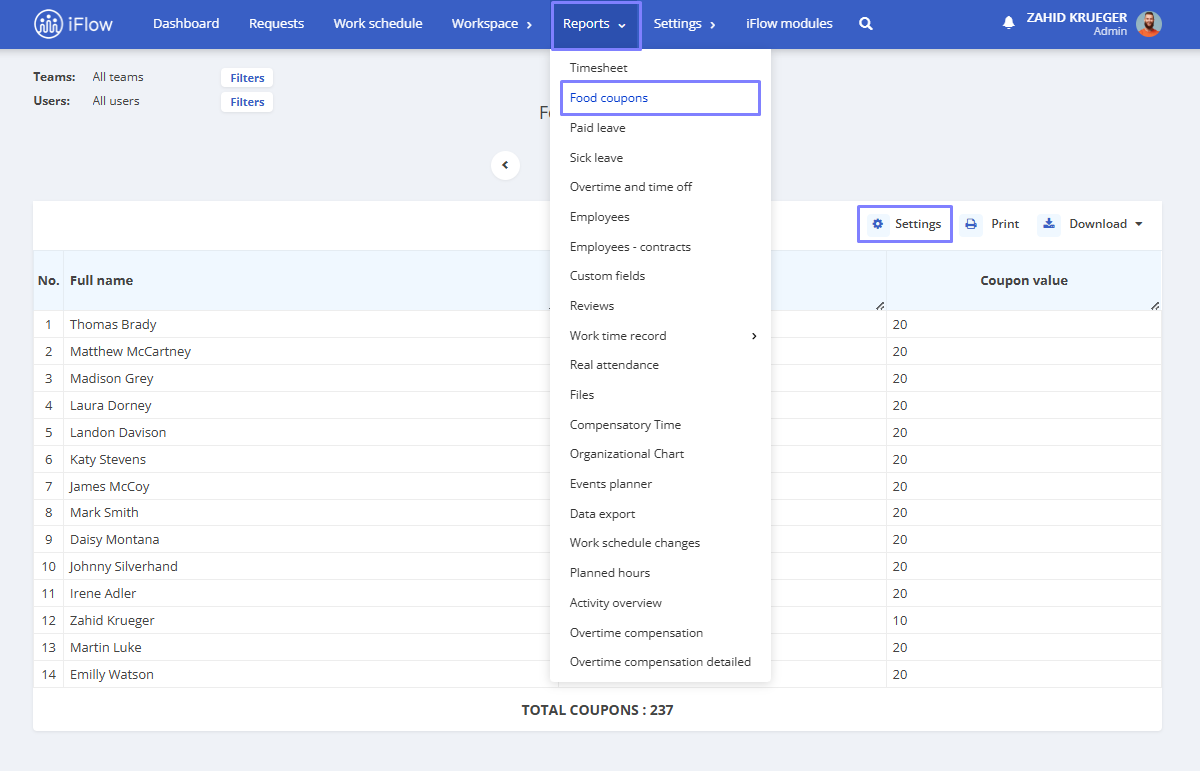
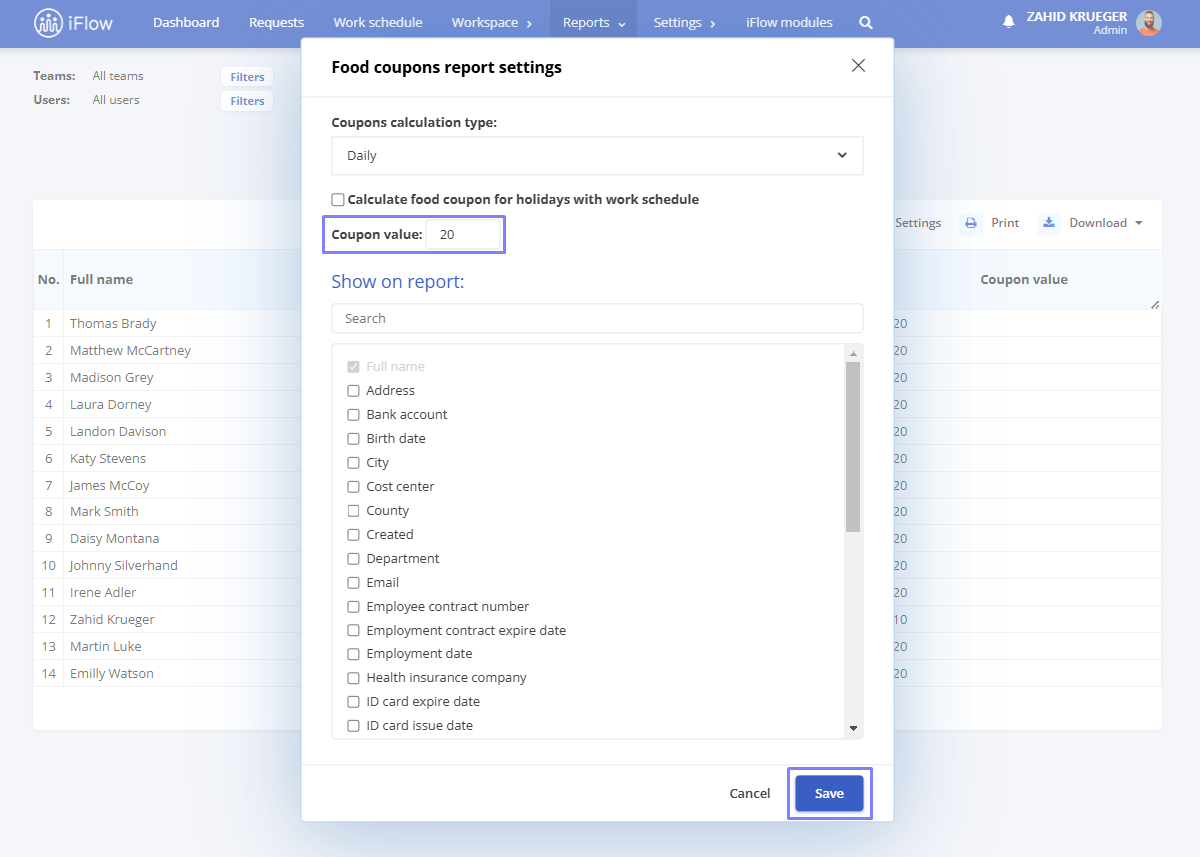
How to define the value of food coupons
- From the main menu Reports – Food coupons
- Click on the Settings button
- Enter the value in the Coupon value field
- Click on Save
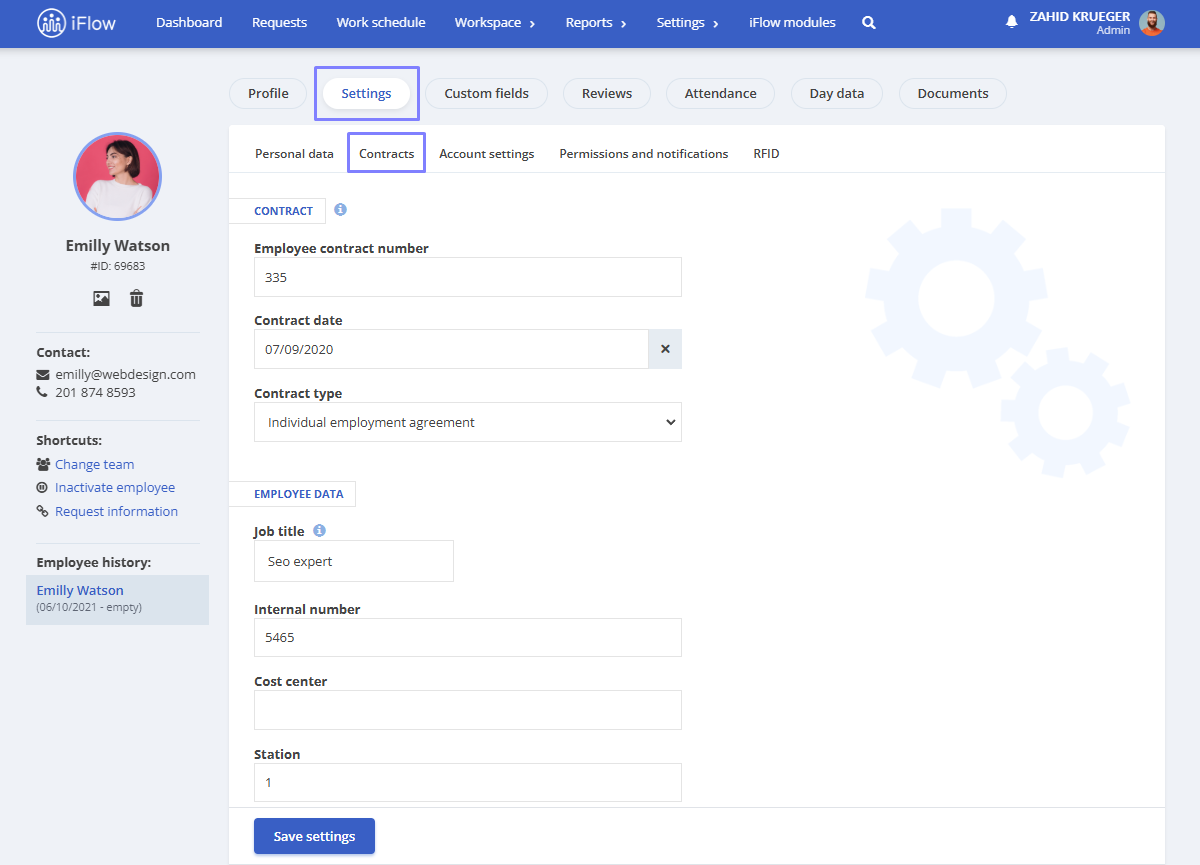
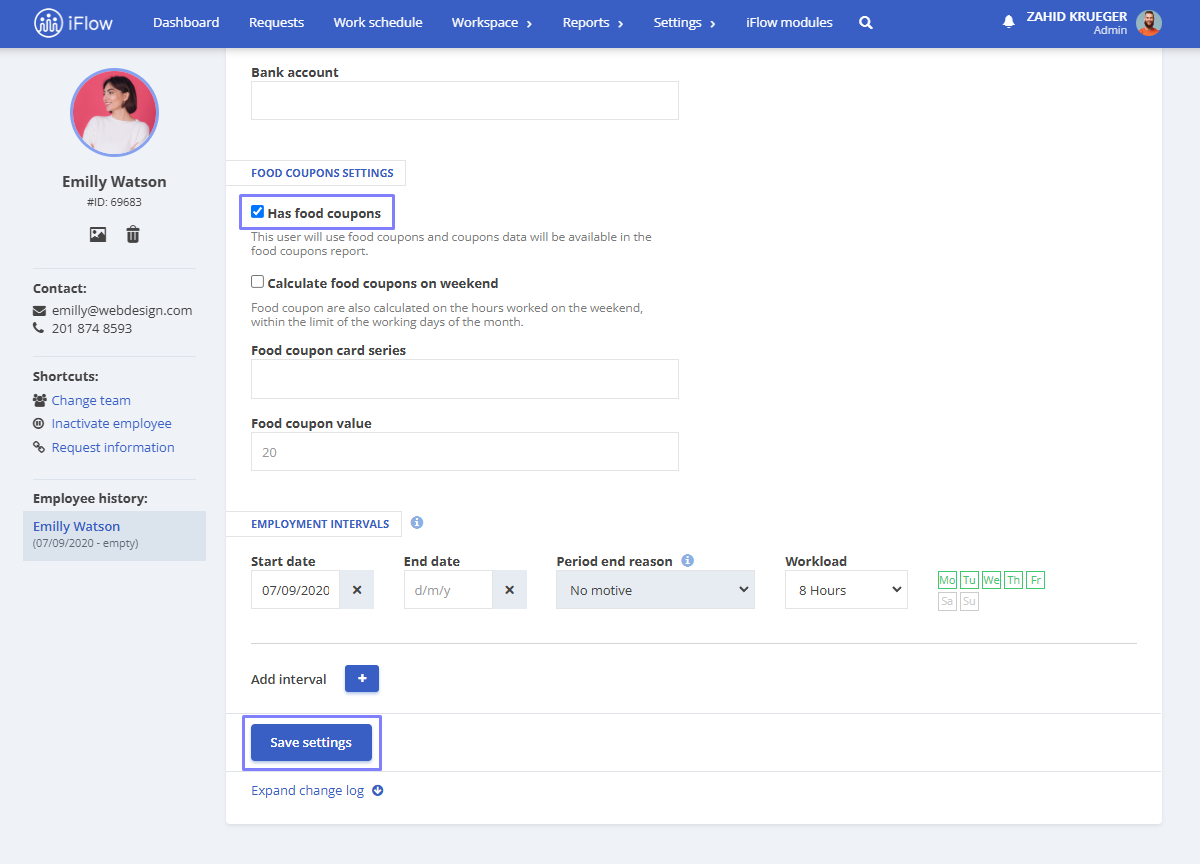
How to choose who receives food coupons
The Has food coupons option is checked by default in the application. If you want to define employees who do not receive Food coupons:
- Navigate to the Employee profile
- Click on the Settings submenu – Contracts
- Scroll to the end of the page
- Uncheck the Has food coupons box
- Click on Save button
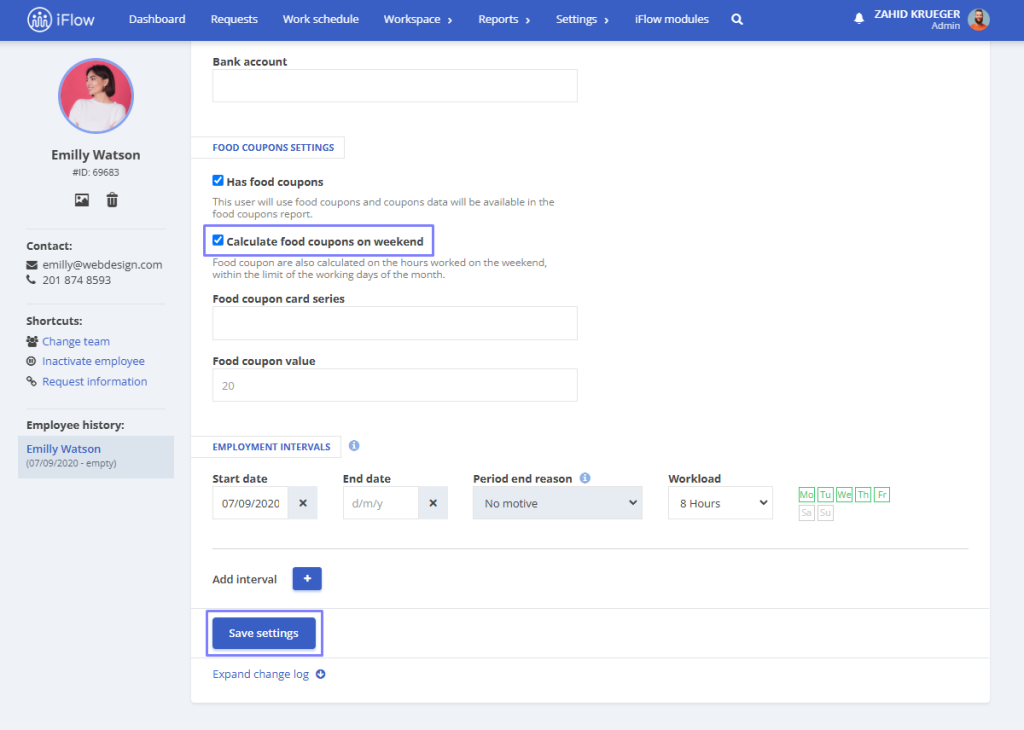
Food coupons for shift work
For shift work schedules, there is an option at the employee profile that, when activated, calculates the employee’s food coupons and hours worked on weekends within the working days of the month:
- Navigate to the employee profile
- Click on the Settings submenu
- Click on Contracts
- Food Coupons settings
- Check Calculate food coupons on weekends
- Click on the Save settings button
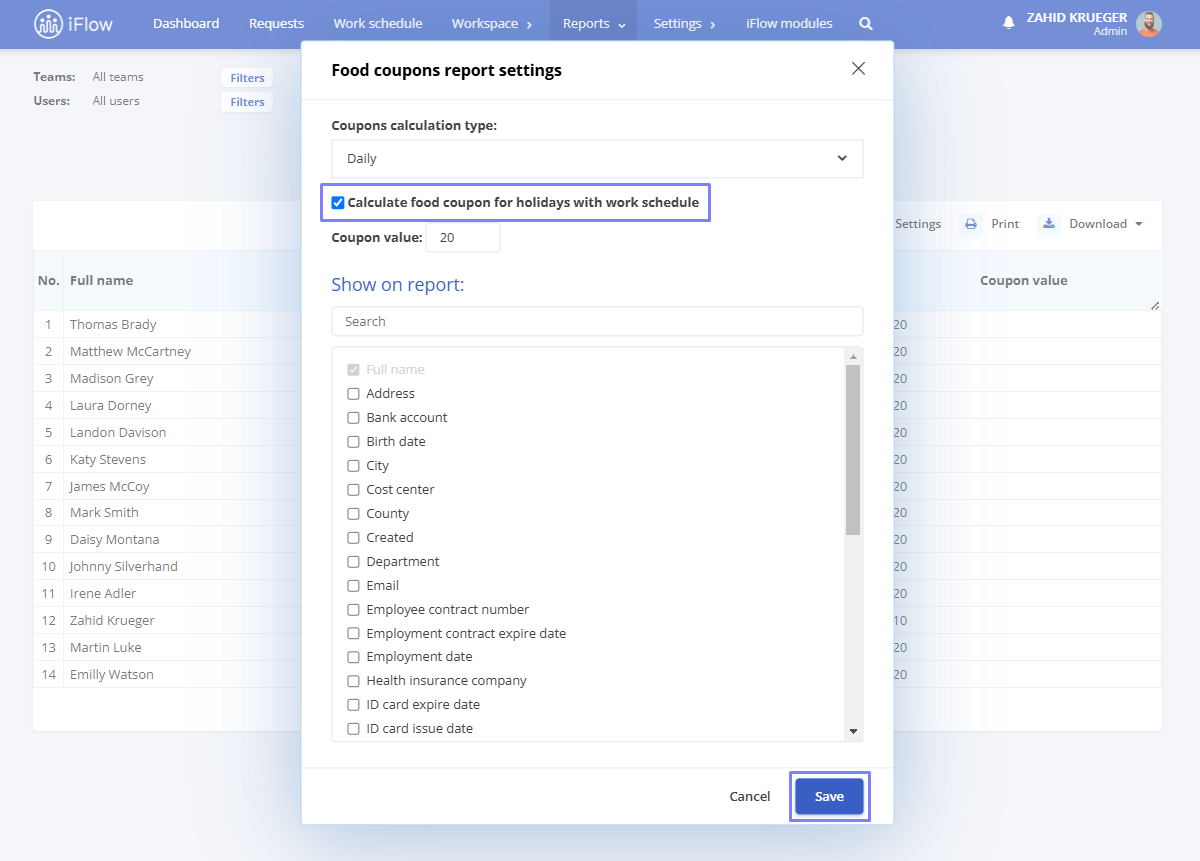
Food coupons for legal holidays
For work schedules that include legal holidays, there is an option on the Company Settings that, when activated, calculates Food coupons for legal holidays with a work schedule within the working days of the month:
- Navigate to the Food coupons report
- Click on the Settings button
- Check the option Calculate food coupon for holidays with work schedule
- Click on the Save button
Food coupons report for Edenred and UpRomania
In the Food coupons report, you have the option to copy data for Edenred or UpRomania:
- Go to the Reports – Food coupons
- Next to the Download button, click on the arrow pointing down
- Copy data for UpRomania or Edenred. With a single click, all updated employee data will be copied, allowing you to complete the voucher provider’s template

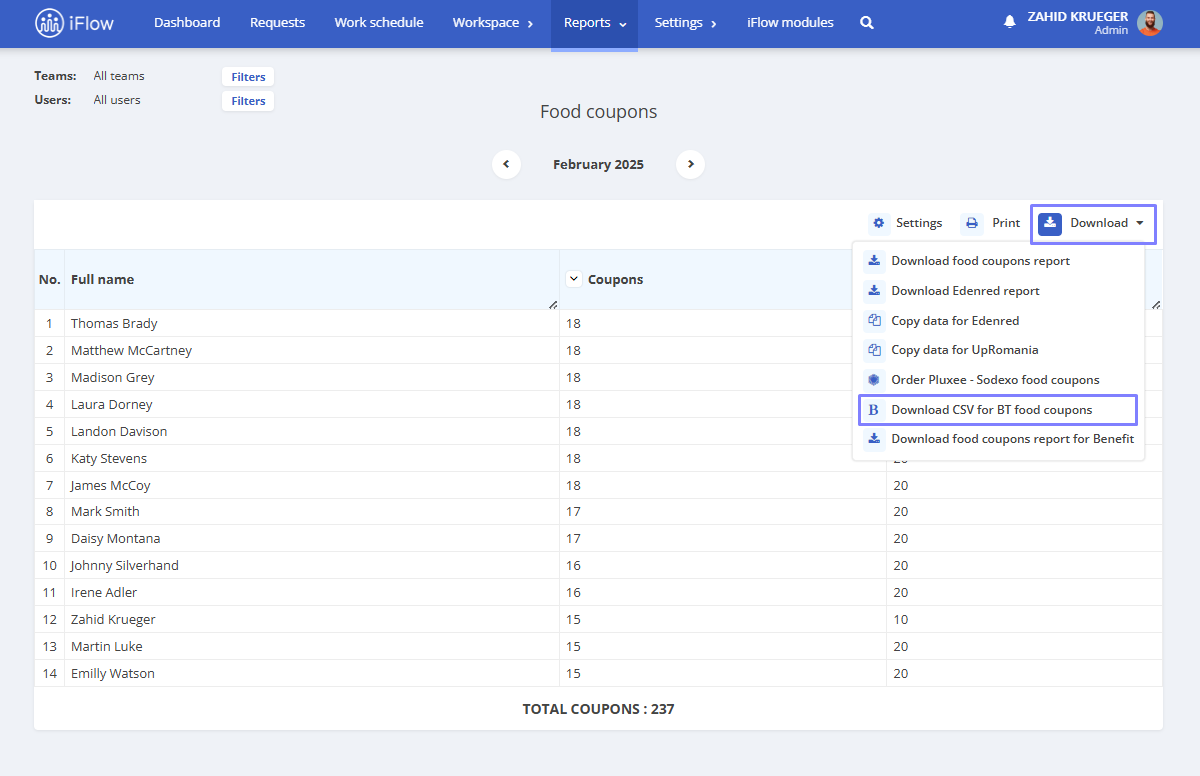
Food coupons report for BT
In the Food coupons report, you have the option to download a CSV file to transfer data to the BT Ticket web application:
- Go to the Reports menu – Food coupons
- Next to the Download button, click on the arrow pointing down
- Click on Download CSV for BT food coupons
- A CSV file with the necessary data will be downloaded for uploading to the BT Ticket web application – all data will be automatically filled, allowing you to order vouchers
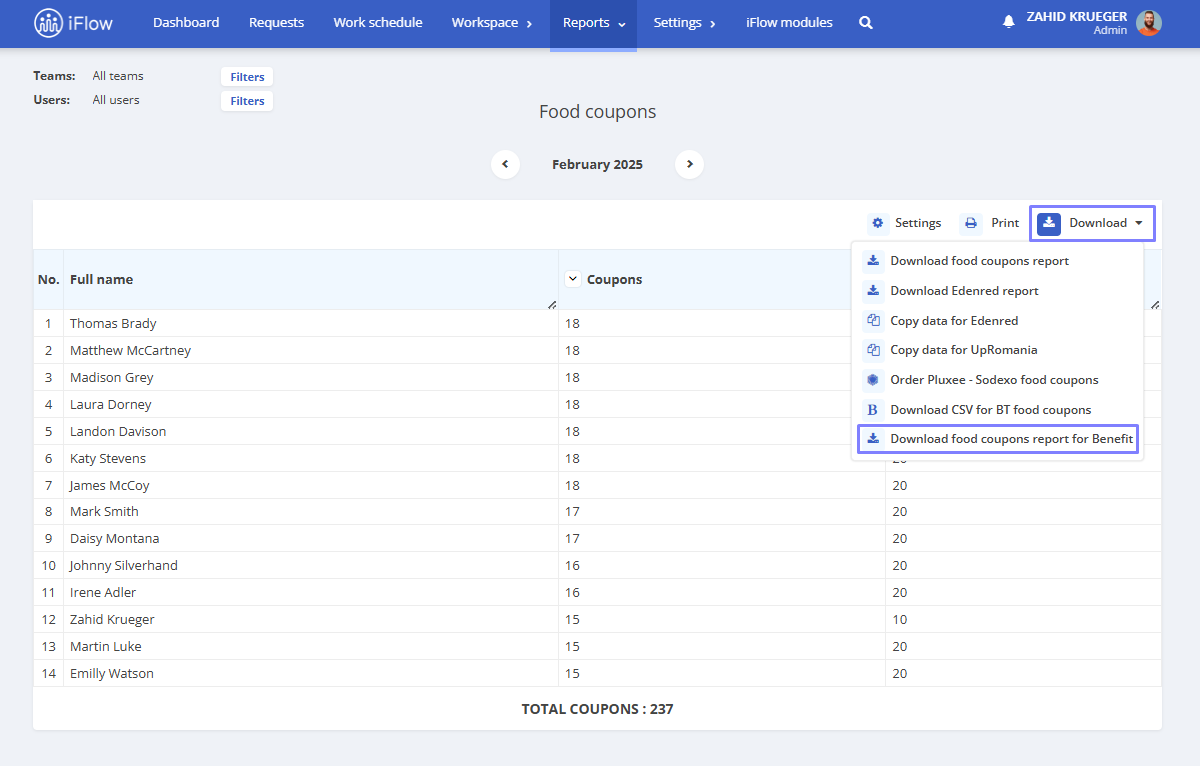
Food coupons report for Benefit
In the Food coupons report, you have the option to download a CSV file to transfer data to the Benefit web application:
- Go to the Reports menu – Food coupons
- Next to the Download button, click on the arrow pointing down
- Click on Download food coupons report for Benefit
- A CSV file containing the necessary data will be downloaded for uploading to the Benefit Ticket web application – all data will be automatically filled in, allowing you to place your order for Food coupons
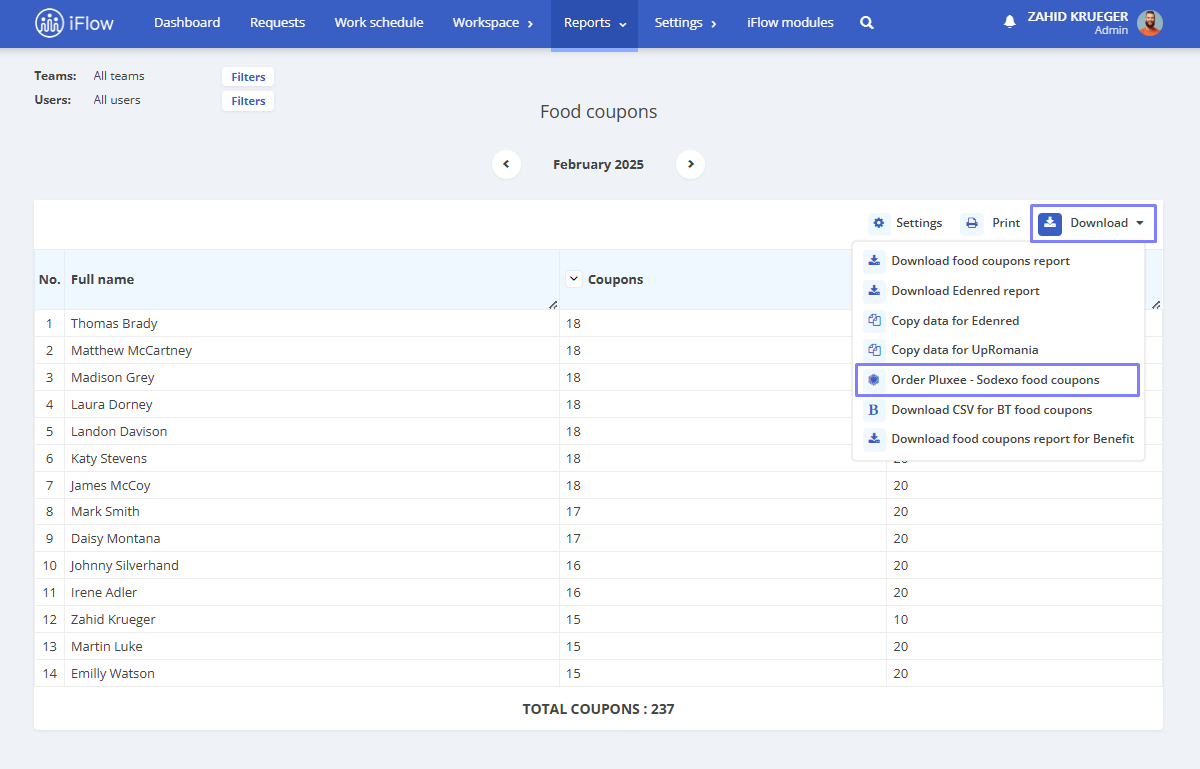
Food coupons report integrated with Pluxee (Sodexo)
The connection between applications is made through an API key, and the process of ordering food coupons proceeds as follows:
- Open the iFlow application and set the work schedule and the value for your employees’ food coupon
- iFlow automatically calculates the amount each employee will receive at the end of the month as a bonus based on pre-established information
- Go to the Reports menu – Food coupons – click on the arrow next to the Download button and select Order Pluxee – Sodexo food coupons
The API key is obtained from the Sodexo application after it needs to be filled in iFlow. If you use Sodexo, email us at [email protected] for a detailed explanation of how to maximize this integration.
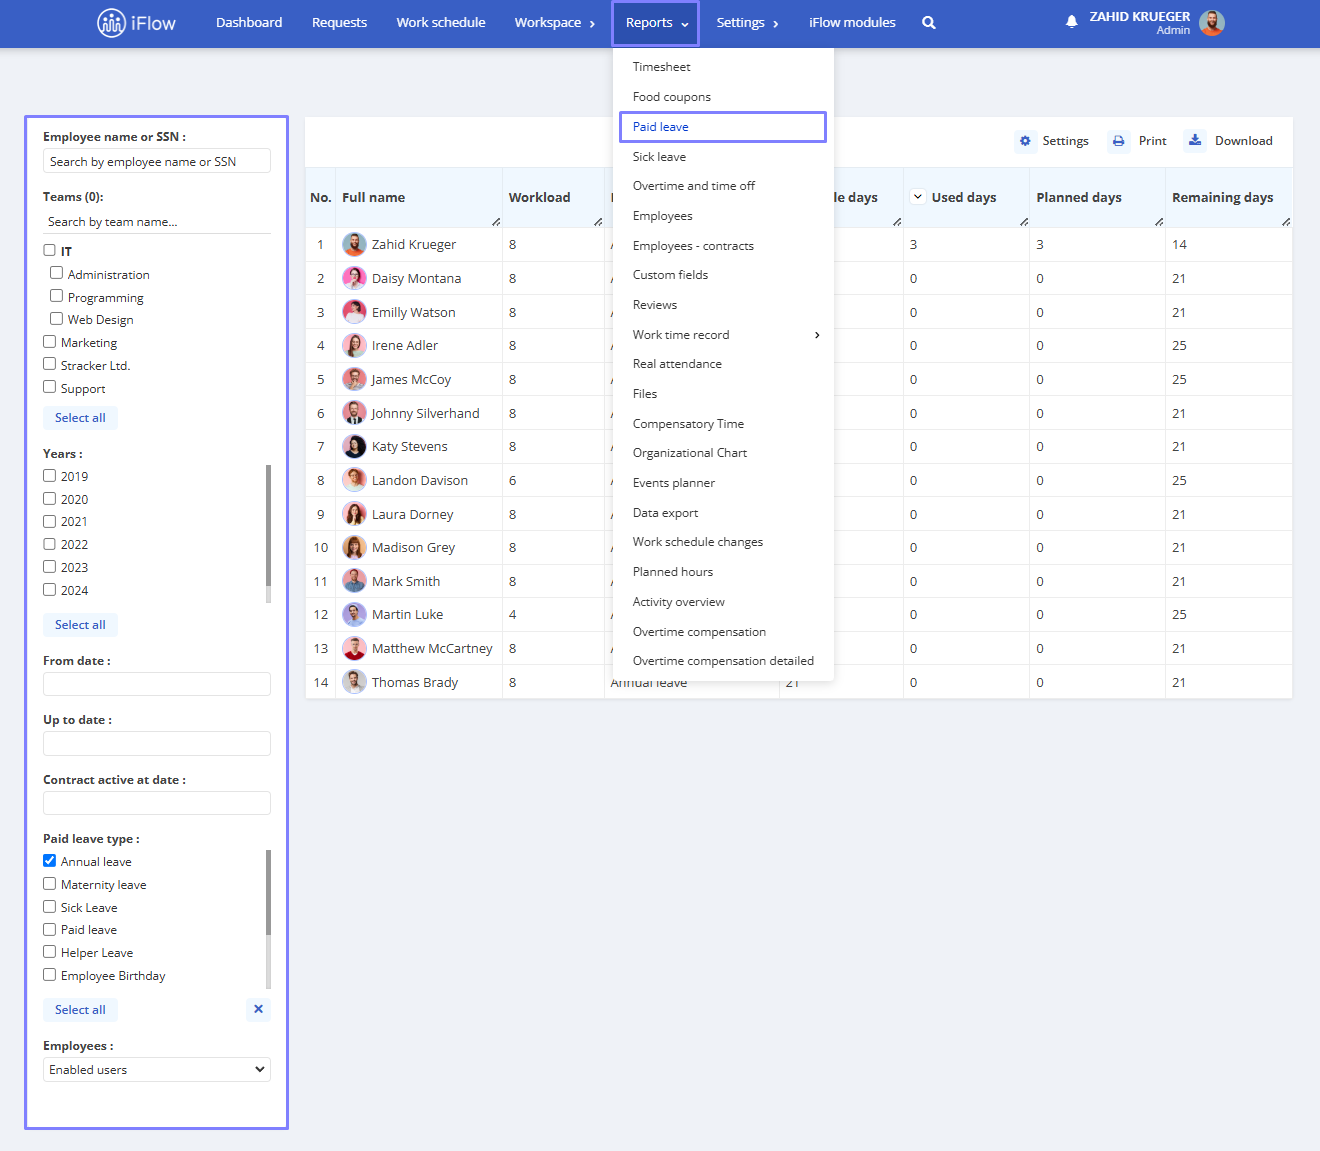
Paid leave
The Paid leave report is generated based on the information registered in the iFlow application. Specifically, it details the number of paid leave days (of any category) allocated for each employee.
Some filters on the left side of the report make it easy to quickly search for employees, including by Employee Name or Social Security Number, Teams, Years, Date range, Paid time off type, and Employees.
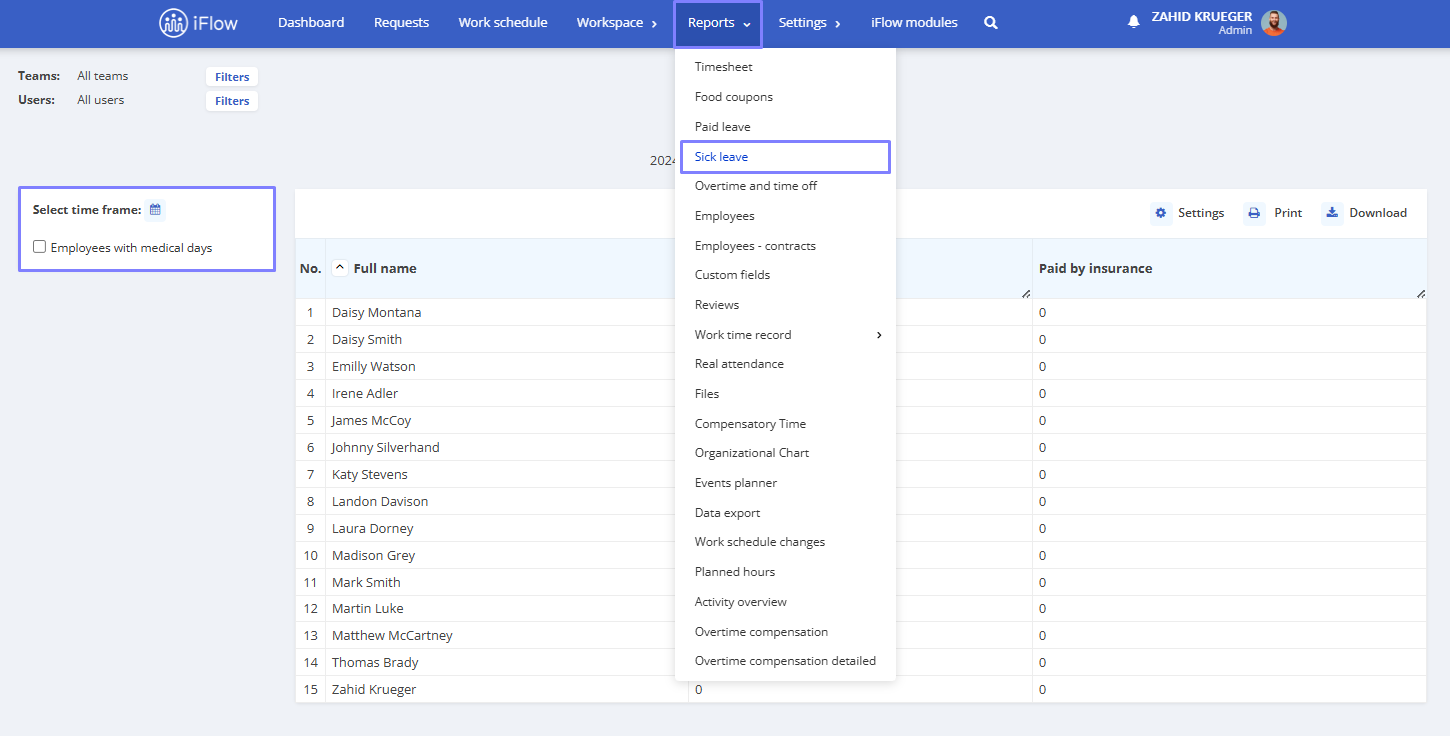
Sick leave
The Sick Leave report is completed based on the sick leave events added to the application. You can filter this report by selecting the period you want to view sick leave.
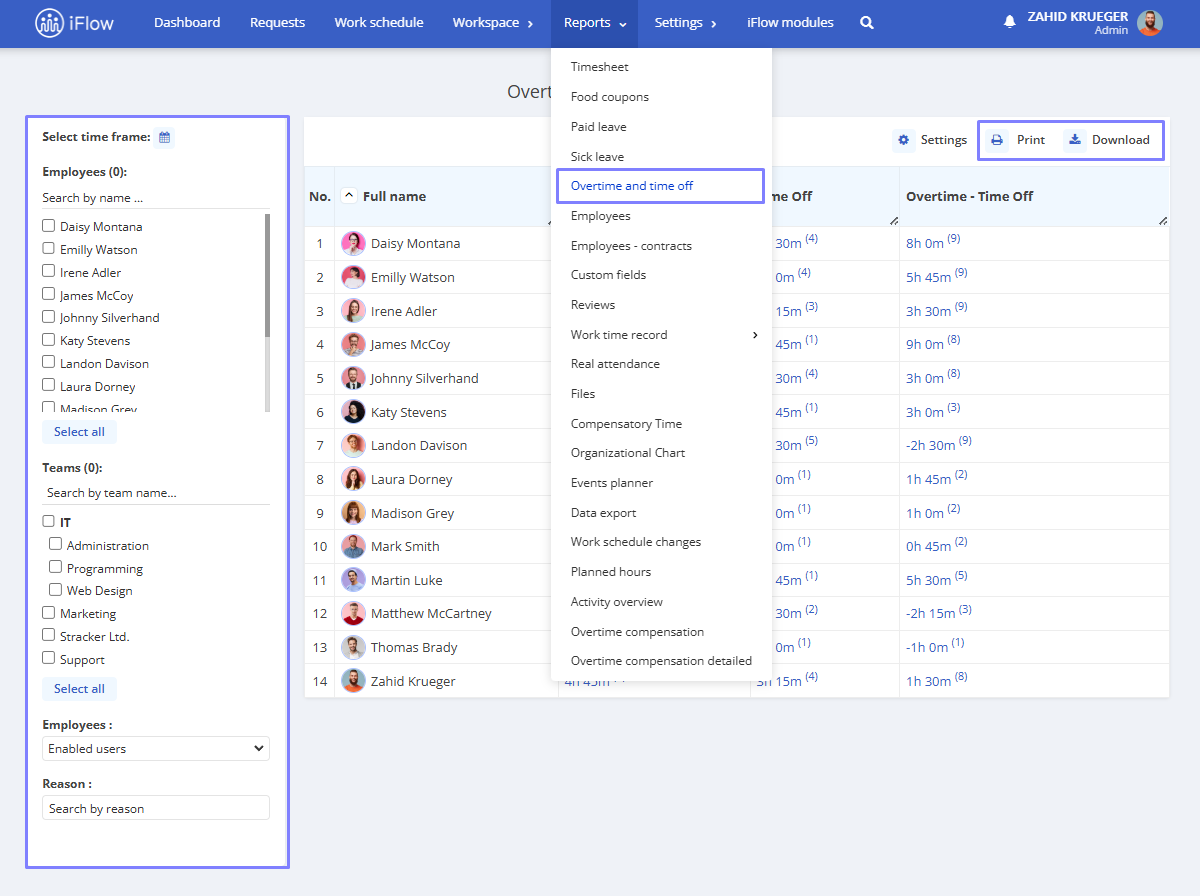
Overtime and time off
This report provides a detailed overview of overtime and time off, presenting the information in a structured table. The data is sourced from overtime events and time off added to the application.
How the overtime and leave report works
- It includes five filters: Period, Employees name, Teams, Employees, and Reason
- Each filled column contains links to the events that are the source of the results and will redirect you to them if accessed
- The numbers in parentheses represent the number of events from which the hours are derived
- It can be Printed or Downloaded in Excel format
Employees
This report contains a table with employees’ personal information and can be filtered by Teams or Employees.
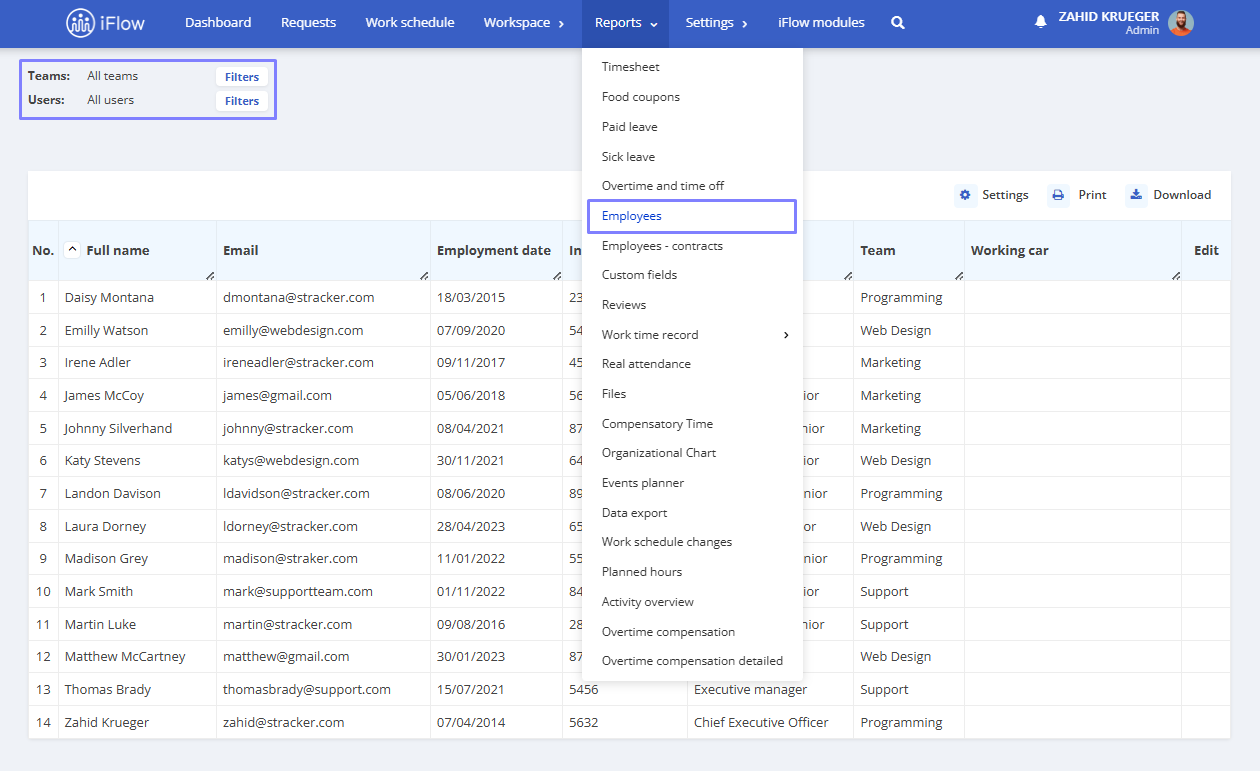
Attention!
To ensure this report is complete, ensure you have filled in all the employee details in their profile. Alternatively, you can do this by pressing the Edit button next to the employee for whom you want to enter or modify data.
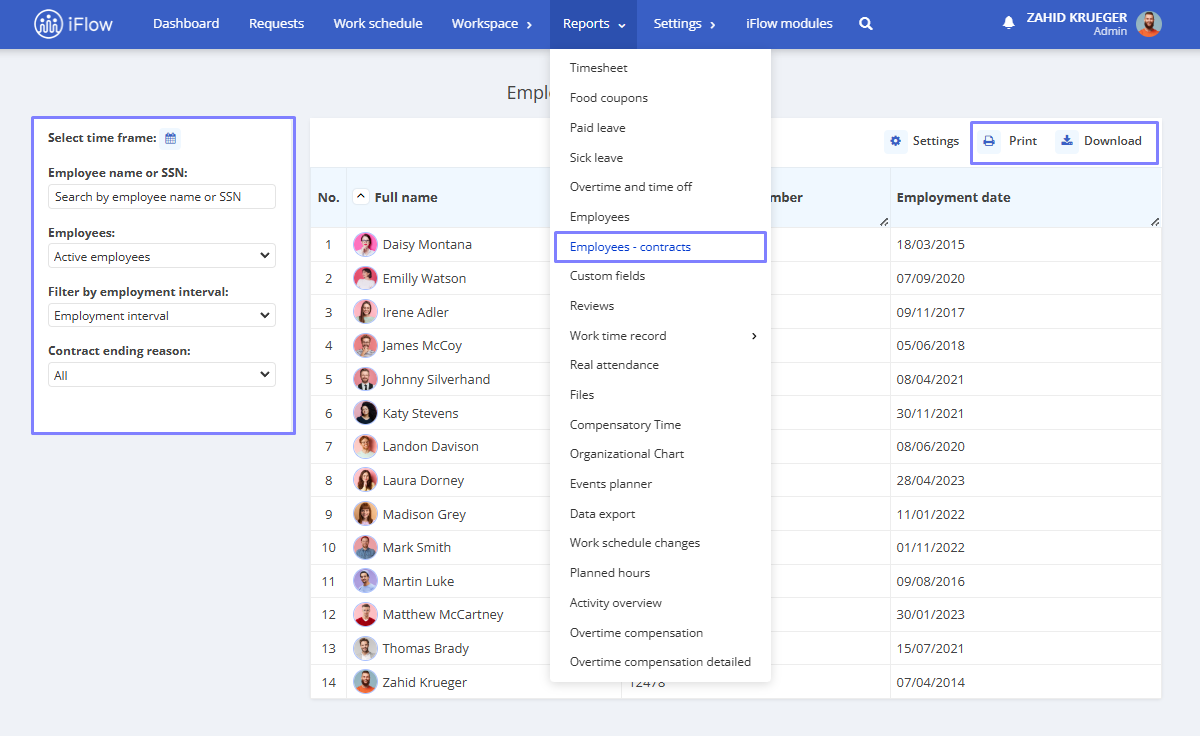
Employees – Contracts
In this report, you will find all the employees in your company and can easily view details related to their employment contract. Even if you have many employees, you can quickly find them using the search option by Employee name or SSN. Other filters to view the report include selecting Active or inactive employees, Filter by employment interval, Contract ending reason, or even Selecting a specific period. Like any other report in iFlow, you can Print or Download it in XLS format.
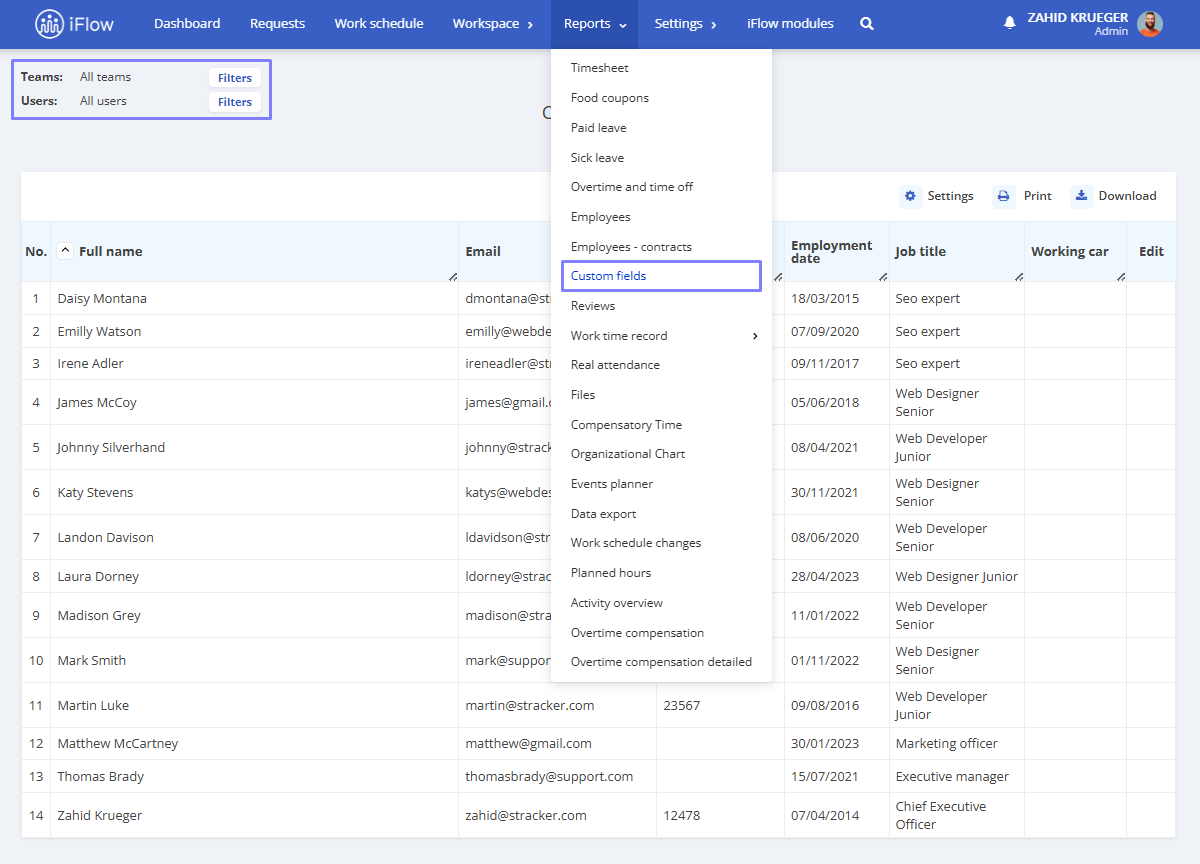
Custom fields
This report tracks the custom fields added to employee profiles. It can also be filtered by Teams or Employees, making it easy to access specific information quickly and efficiently.
Reviews
Open the Reports menu – the Reviews submenu.
This report brings all evaluations created, regardless of their status.
On the left side of the report, you will find several filters:
- Select the period
- Reviewer– the person conducting the evaluation
- Employee reviewed – the person being evaluated
- Teams – the team to which both the evaluator and evaluated Employee belong
- Review types – the name of the evaluation session
- Status:
- All – displays all evaluations
- None – if the session is not started
- Added – if the session has started
- Partial – the evaluation has begun but is not completed
- Completed – the evaluation is finished
- Score
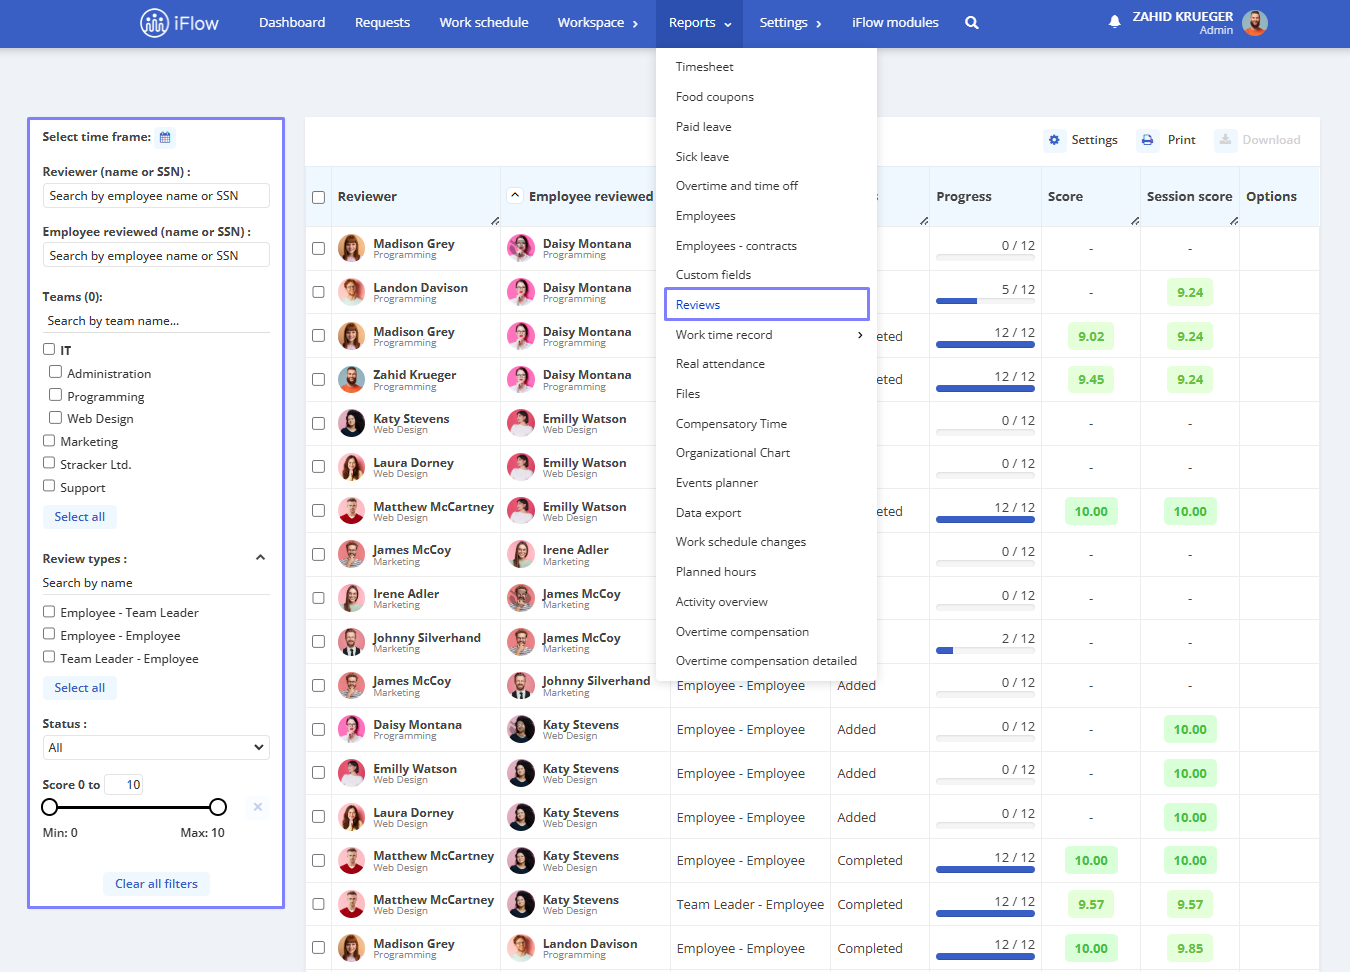
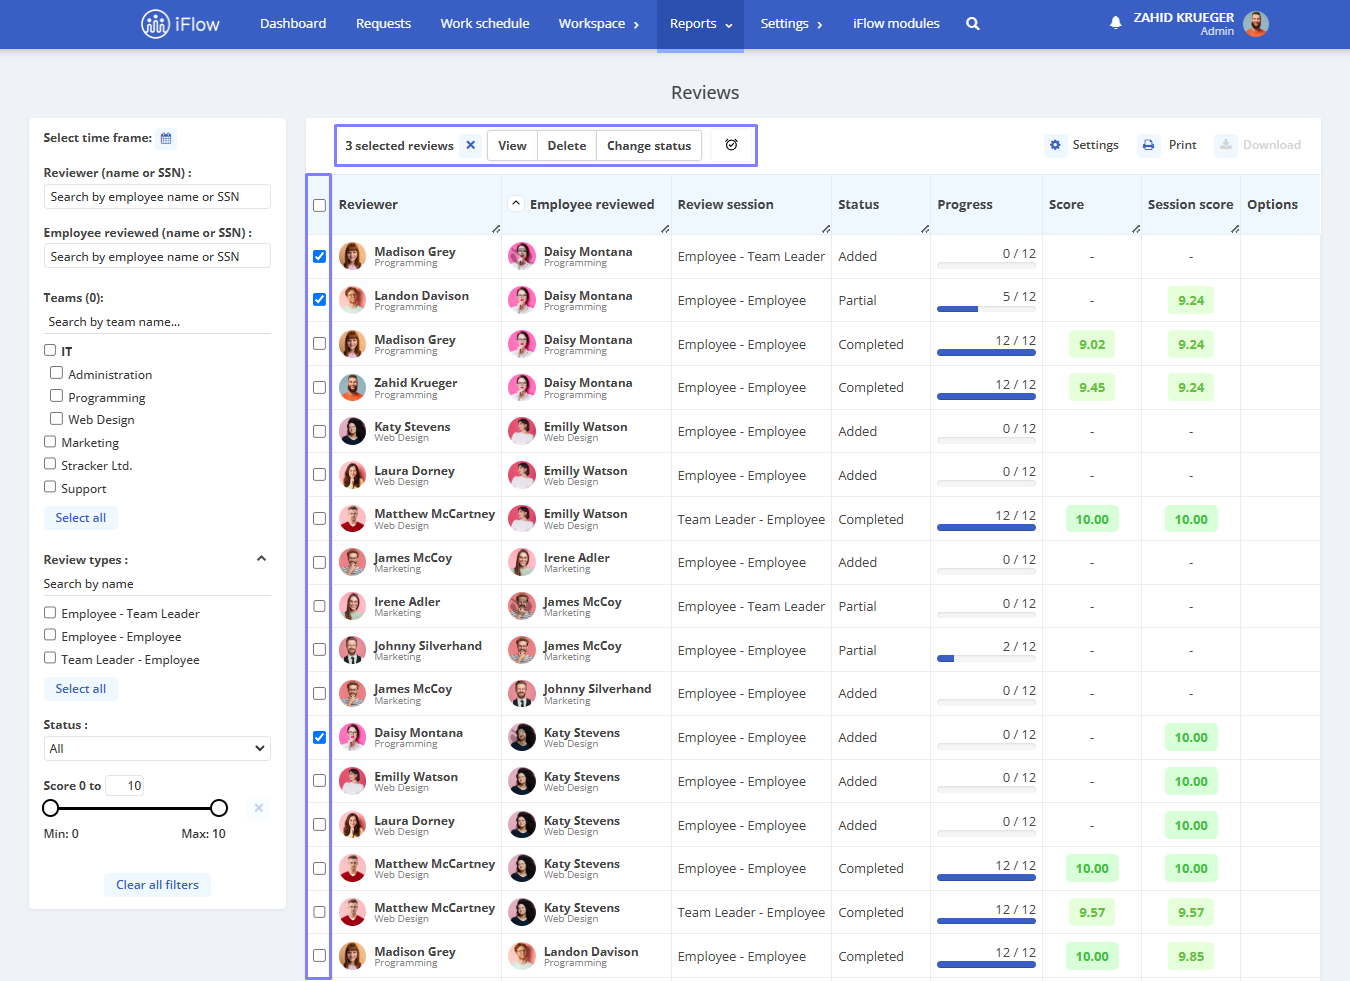
You can select by checking the boxes following the evaluators or by using the bulk selection by checking the box in the top left corner of the table. Also, at the top of the report, you will find options for viewing, deleting, changing status, or adding a reminder.
Additionally, you can select multiple evaluations at once to compare the responses of several members from different sessions, making it easier and quicker to compare employee answers.
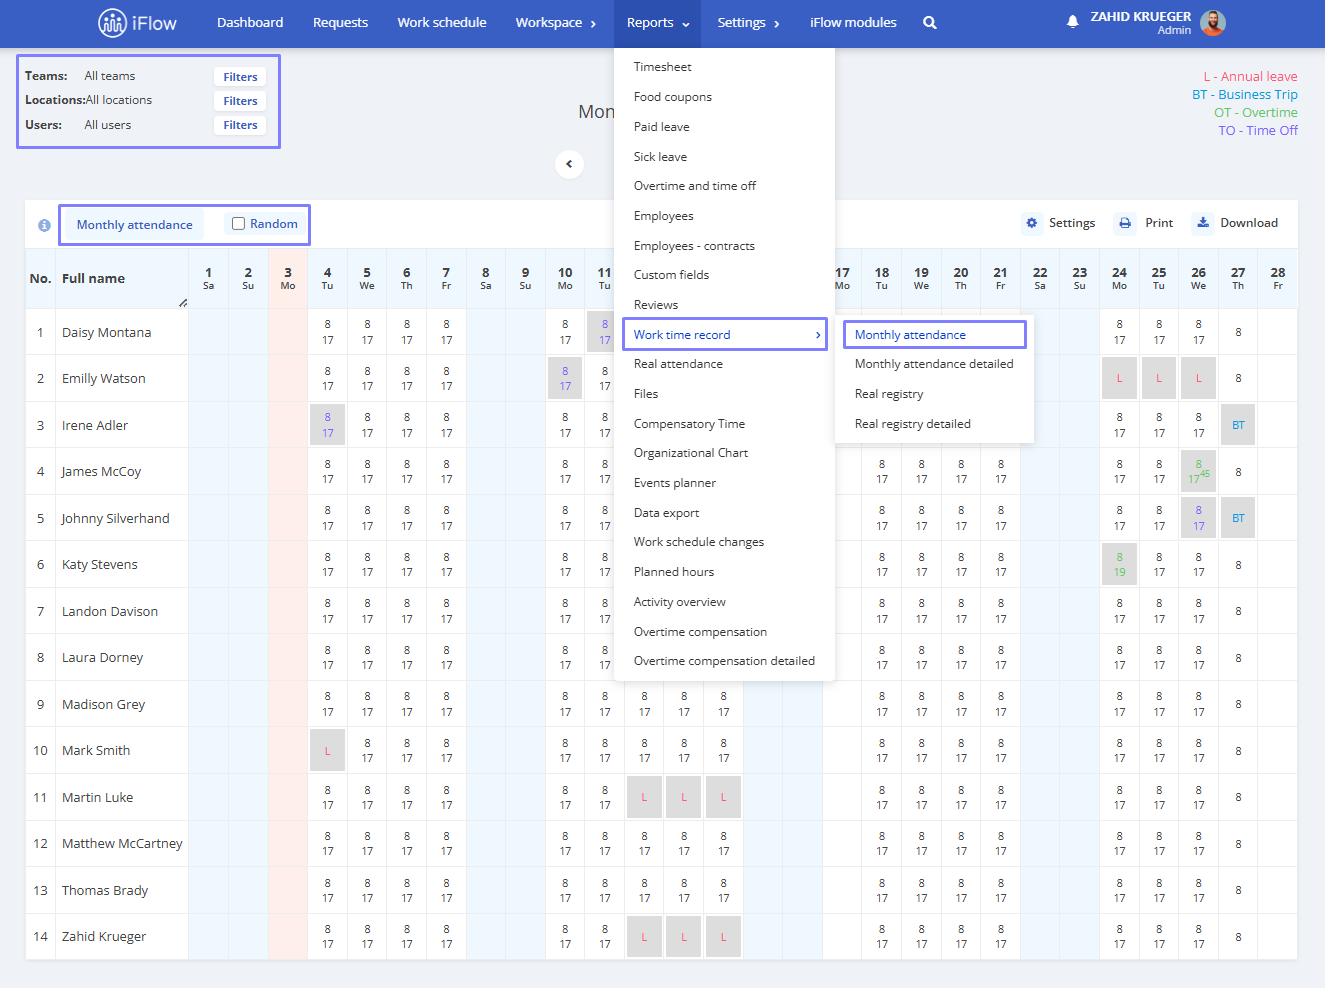
Monthly attendance
The Monthly attendance report provides a detailed overview of hours worked, using employee work schedule as the data source. This report is automatically updated to the current day, ensuring real time activity monitoring.
The report includes three primary filters for customization and detailed analysis:
- Teams – Allows you to view and compare work hours across different teams within the organization
- Locations – Facilitates the analysis of work hours based on the locations where the activities take place
- Employees – Provides the option to detail work hours at an individual level for each selected employee
Additionally, the report enables seamless switching between different reports for an integrated and detailed perspective on Monthly attendance. The Randomize button adjusts work hours to ensure the schedule is as accurate and realistic as possible.
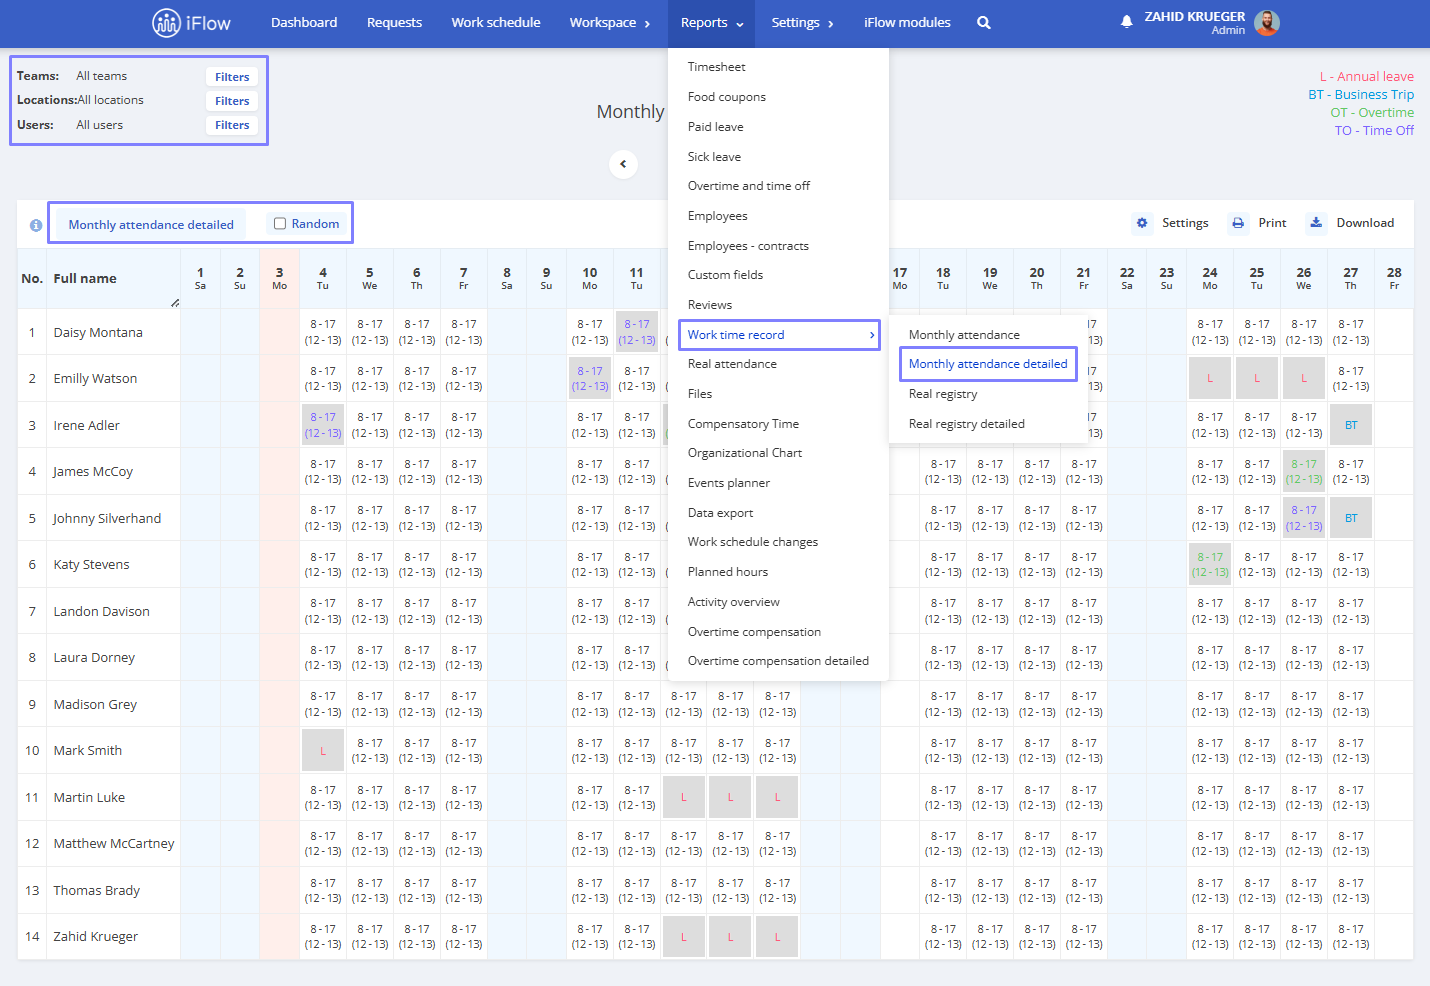
Monthly attendance detailed
The Monthly attendance detailed report provides an in-depth view of work hours, including breaks, based on the predefined work schedule. This report is automatically updated to the current day, ensuring real-time activity monitoring. It is available for Printing or Downloading.
The report includes three primary filters for customization and detailed analysis:
- Teams – Allows you to view and compare work hours across different teams within the organization
- Locations – Facilitates the analysis of work hours based on the locations where activities occur
- Employees – Provides the option to detail work hours at an individual level for each selected employee
Additionally, the report allows seamless switching between different reports for an integrated and detailed perspective on Monthly attendance detailed data. The Randomize button adjusts work hours to ensure the schedule is as accurate and realistic as possible.
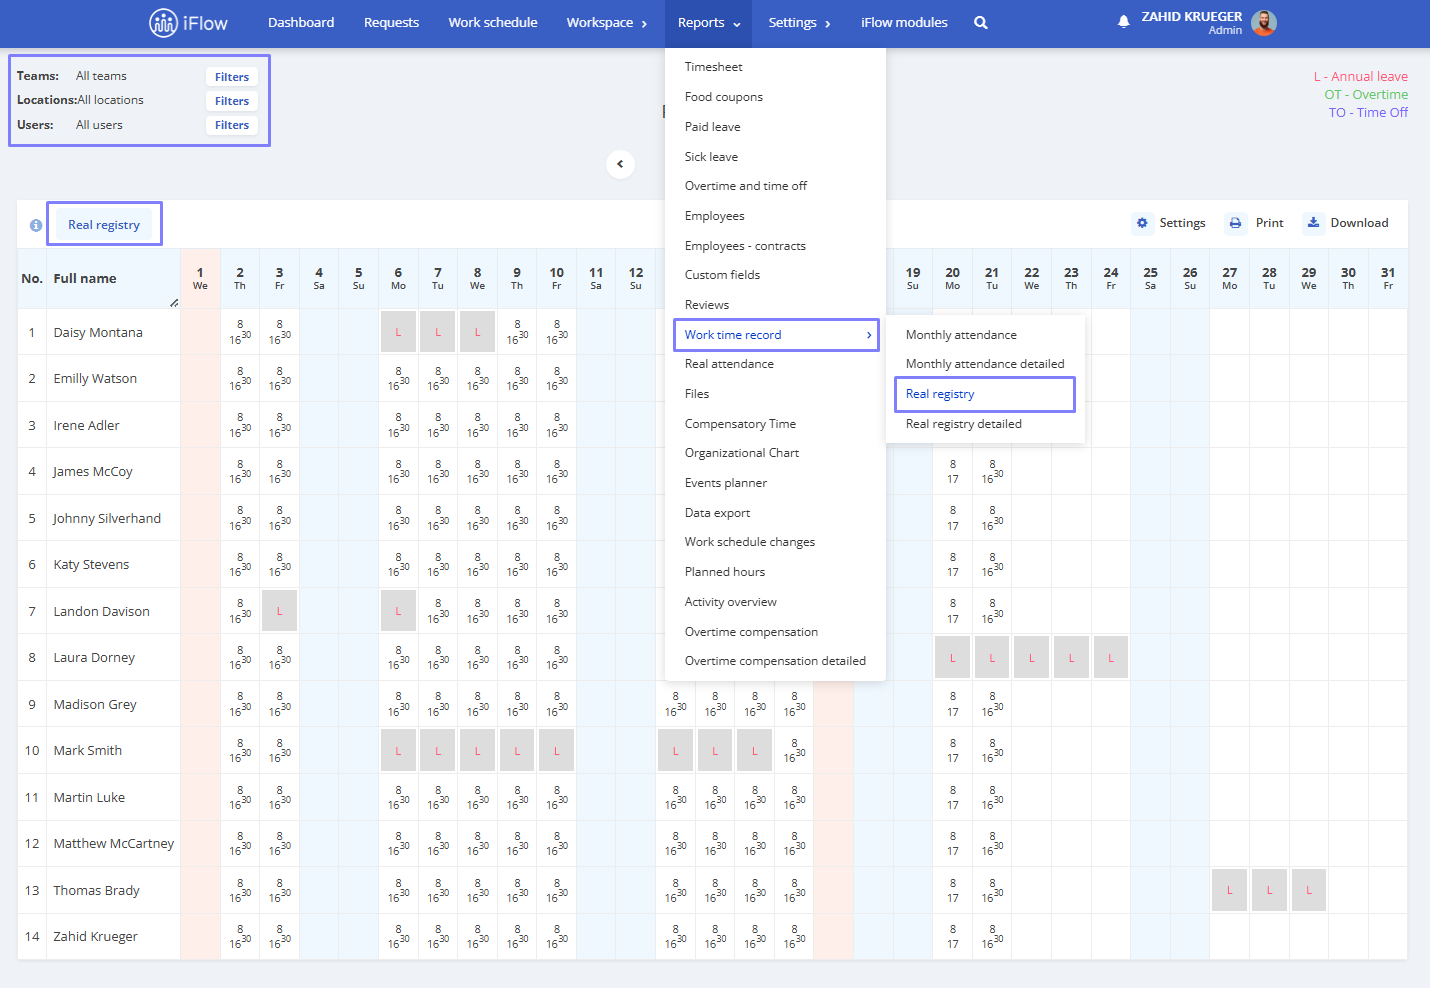
Real registry
The Real registry report is designed for companies using real-time attendance tracking. It automatically compiles data for each employee based on check-in and check-out actions, as well as special events such as paid leave, medical leave, or other custom events that must be displayed in work time records. Check-in and check-out records are included in the report regardless of the method used, whether RFID card, direct PC clocking, or smartphone. The report is available for Printing or Downloading.
Each cell in the report includes a link to each employee’s day data panel, simplifying activity monitoring and management. Additionally, any issues are flagged in each cell with red text, allowing for quick identification and resolution with a single click on the cell.
The report includes three primary filters for customization and detailed analysis:
- Teams – Enables the viewing and comparison of work hours across different teams within the organization
- Locations – Facilitates the analysis of work hours based on the locations where activities are performed
- Employees – Provides the ability to detail work hours on an individual level for each selected employee
Moreover, the report allows seamless switching between various reports for an integrated and detailed perspective on Real registry data.
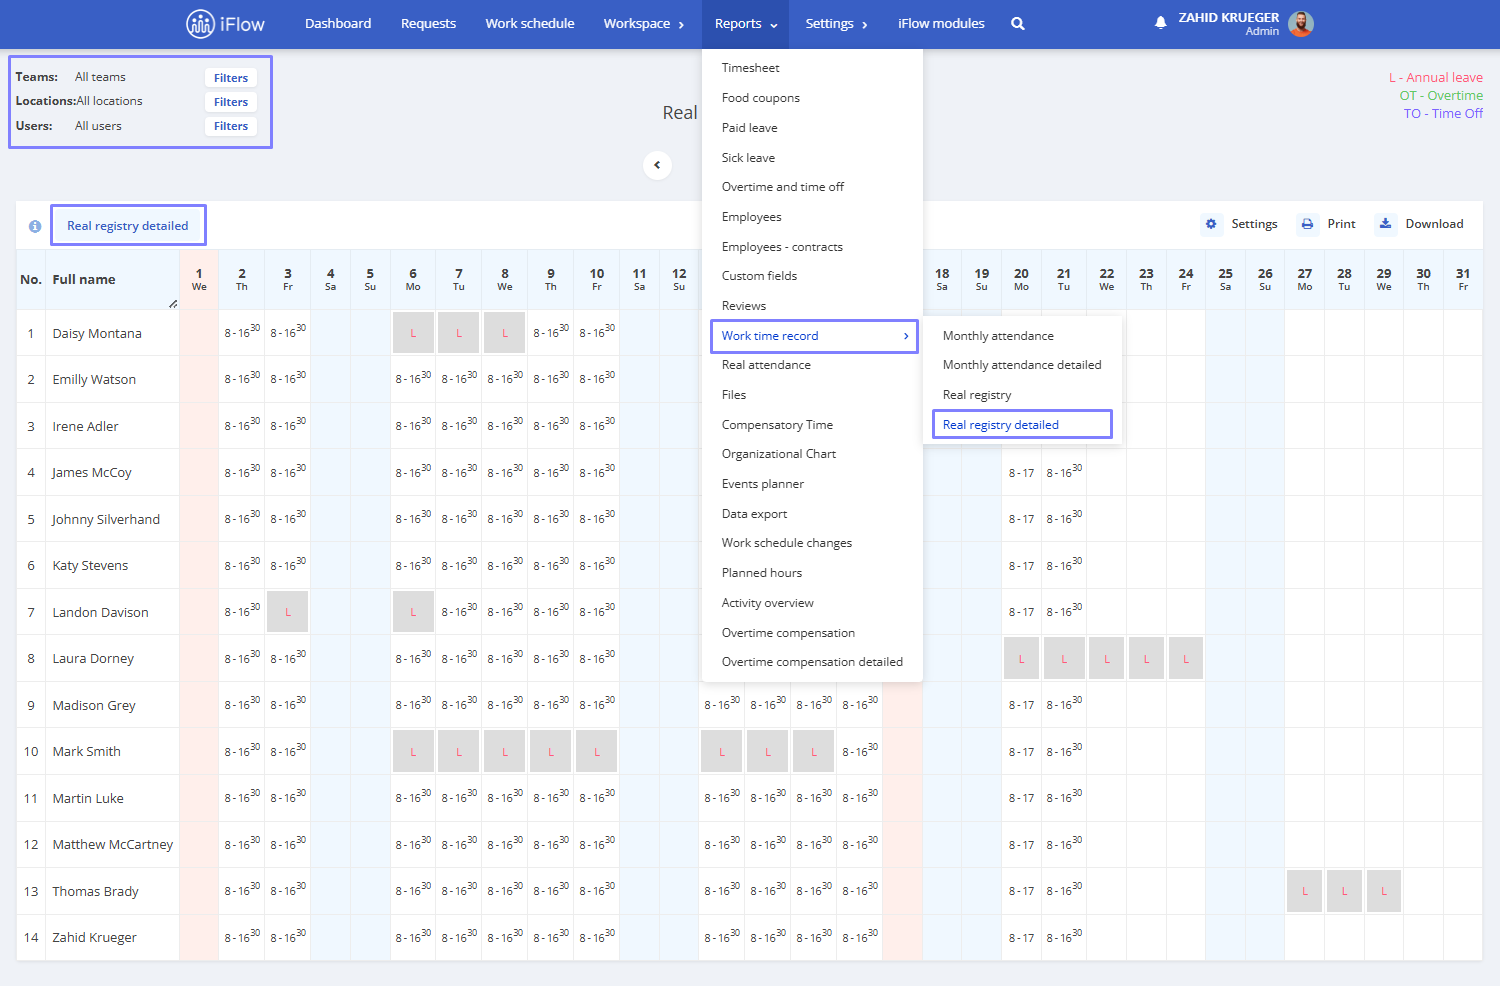
Real registry detailed
The Real registry detailed report is designed for companies using a live attendance system and managing multiple attendance intervals, making it especially useful for those with flexible schedules. This report automatically compiles data for each employee based on check-in and check-out actions, as well as events such as paid leave, sick leave, or other custom events that need to be displayed in work time records.
Each cell in the report includes a link to each employee’s Day data panel, simplifying activity monitoring and management. Additionally, any issues are flagged in each cell with red text, allowing for quick identification and resolution with a single click on the cell.
The report includes three primary filters for customization and detailed analysis:
- Teams – Enables the viewing and comparison of work hours across different teams within the organization
- Locations – Facilitates the analysis of work hours based on the locations where activities are performed
- Employees – Provides the ability to detail work hours individually for each selected employee
Moreover, the report allows seamless switching between various reports, providing an integrated and detailed perspective on Real registry data.
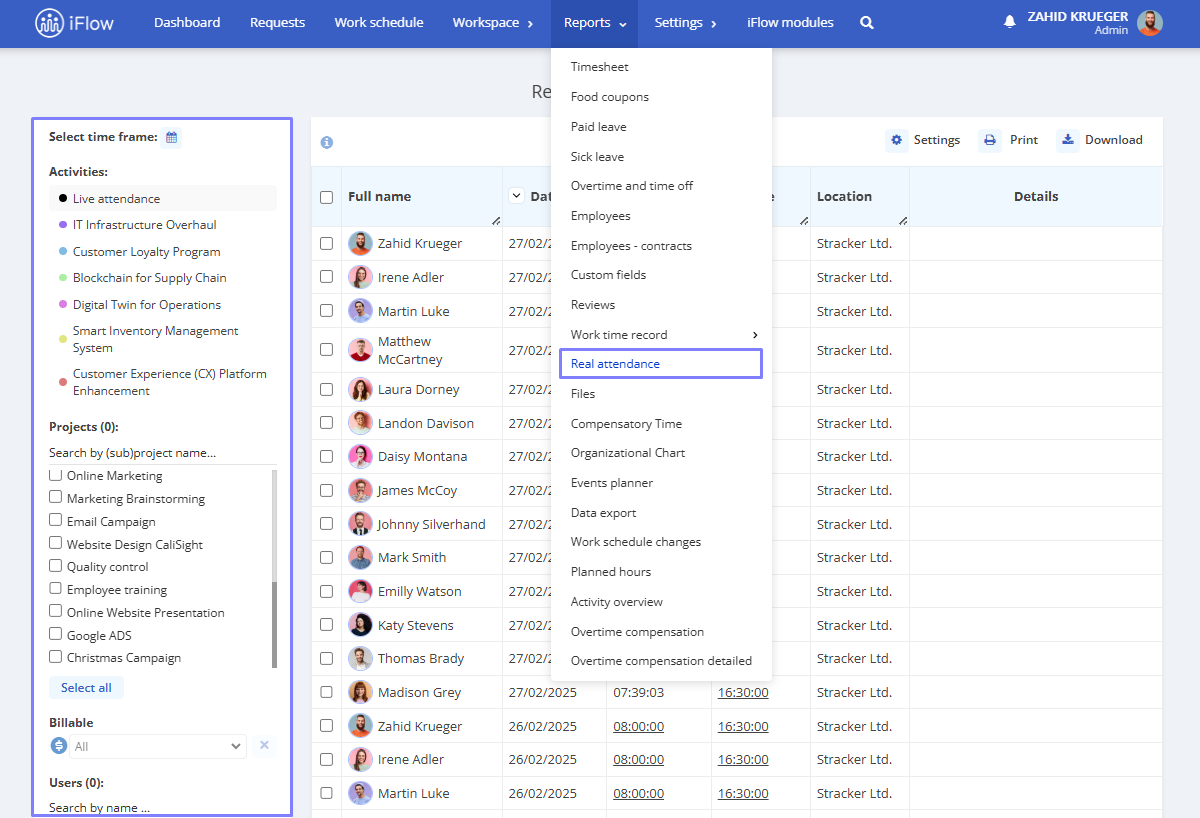
Real attendance
The Real attendance report displays data up to the current day and includes several filters that allow you to refine the information as needed:
- Select time
- Activities
- Projects
- Billable
- Users
- Teams
- Locations
- Interval type
- Terminal type
- RFID Device
- Hours interval
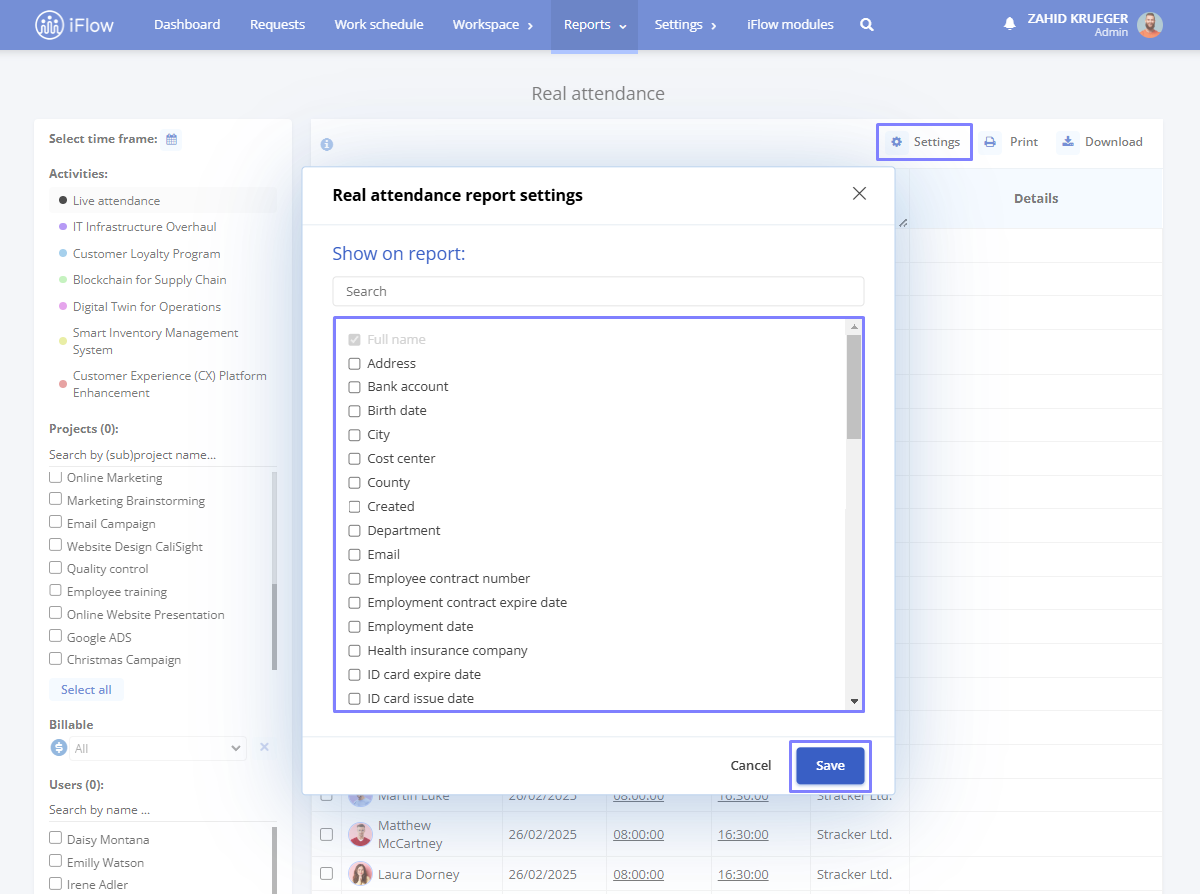
How to customize the real attendance report
The Real attendance report can be tailored using the Settings button in the table’s top-right corner.
This feature allows you to display additional data beyond the default information on the report.
Some of the available fields include:
- Start time
- End time
- Terminal type
- RFID agent (displays the device used for clocking in)
- Closed RFID agent
- IP public
- Location (shows the location where the user clocked in)
- Project (displays the project worked on)
- Subproject (shows the subproject worked on)
- Is mobile device (whether the user clocked in via mobile)
- GPS status
- GPS longitude
- GPS latitude
- Added by
- Added date
- Closed GPS status
- Closed GPS longitude
- Closed GPS latitude
- Closed by
- Closed date
- Closed location
- Closed is mobile device
- Photo start
- Photo end
- Attendance note, etc.
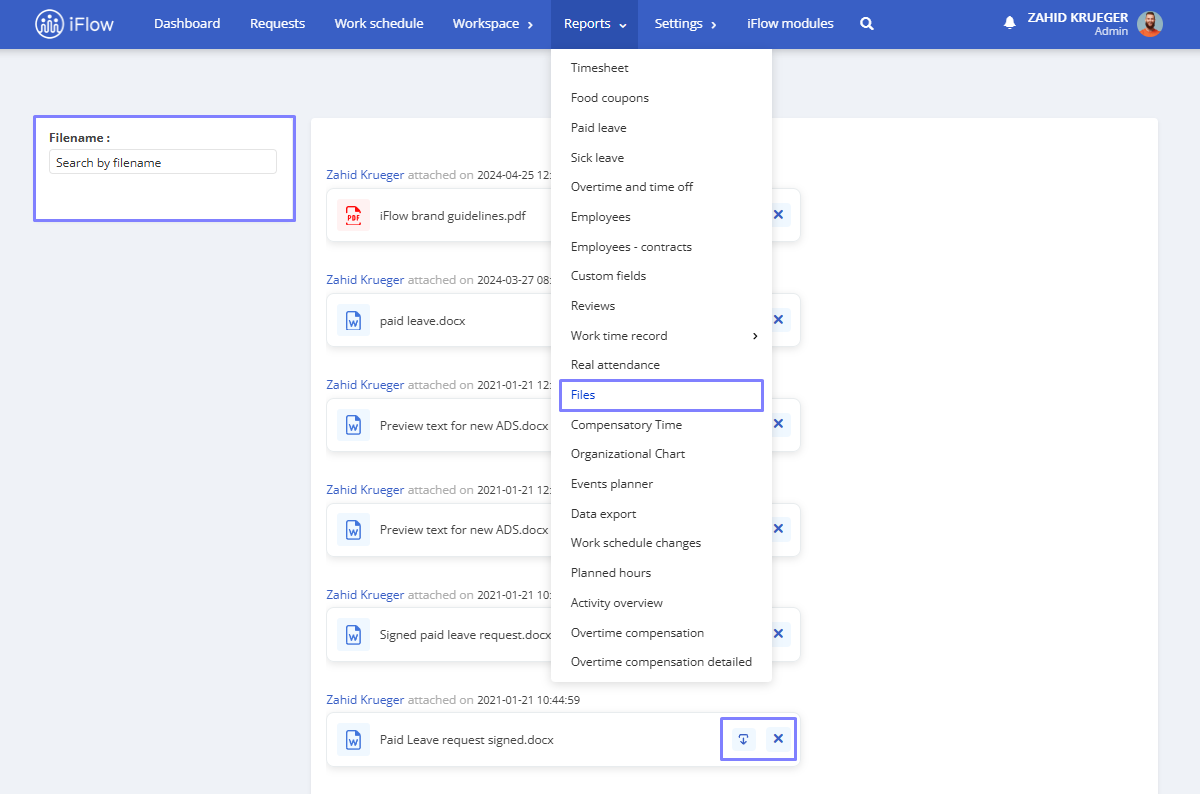
Files
The report lists all attached files, and on the left side, there is an option to search for the File name. For each file, information is displayed about who attached it, the date, and time it was added to the application. Additionally, files can be Deleted or Downloaded using the buttons in the report.
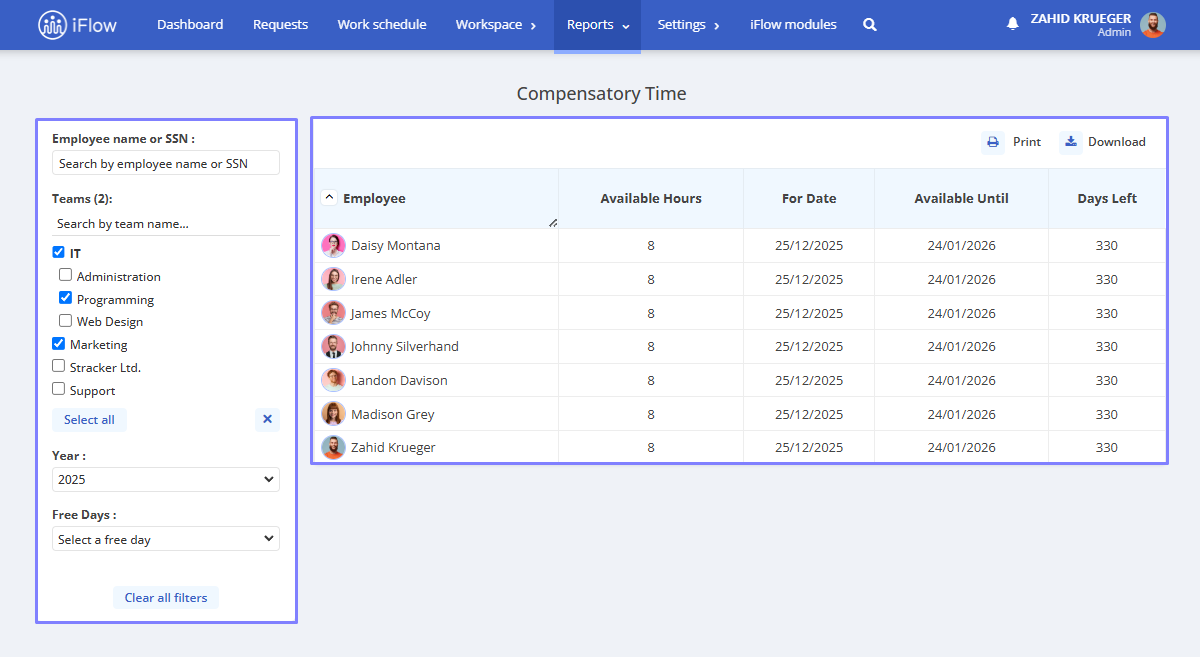
Compensatory time
The Compensatory time report tracks work performed on public holidays. If employees are scheduled to work on these days, the report displays the hours worked, the activity date, the expiration date for recovery, and the number of days remaining.
The recovery report consists of 5 predefined columns:
- Employee – Displays the employee’s name
- Available hours – The hours worked on the public holiday
- For date – The date on which the employee worked (the public holiday)
- Available until – The expiration date for the recovery period
- Days left – The number of days left until the available hours expire. This is set in the recovery event. To configure a specific validity period for recovery, refer to the guide for Public holidays
This report also includes a set of filters to streamline the necessary information. These filters include options for Employee name or SSN, Teams, Year, and Free days.
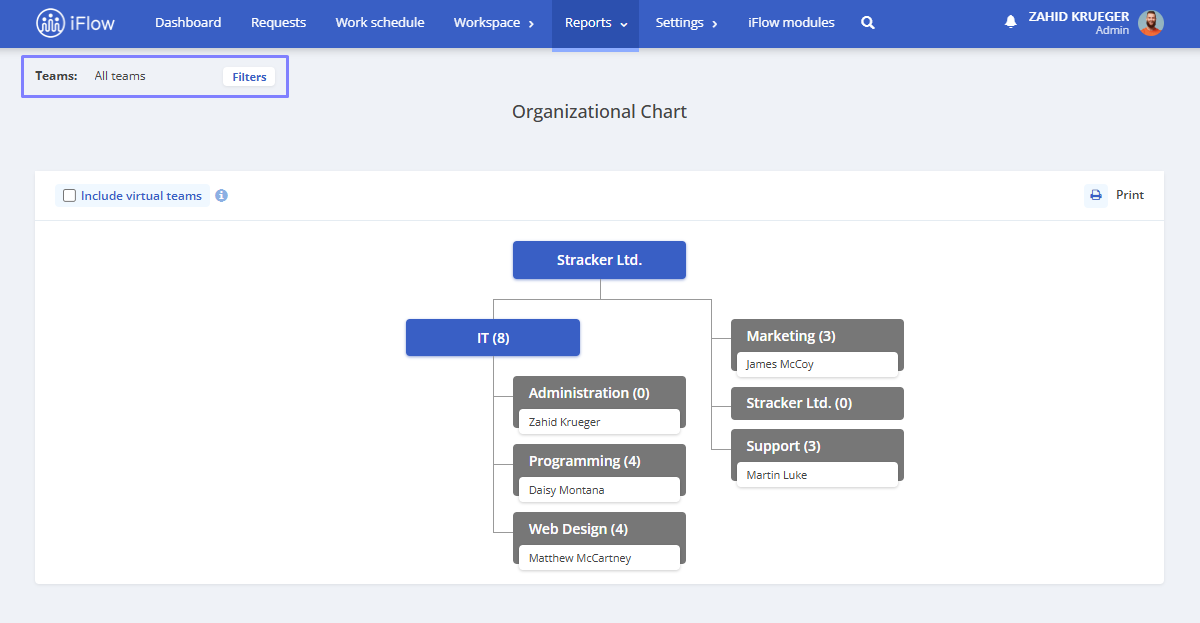
Organizational chart
The application’s Organizational chart report is generated based on the teams and departments created, highlighting individuals who are leaders or administrators.
Click Reports – Organizational chart from the Dashboard to access the company’s organizational chart. Here, you can view the organizational chart generated by parent departments, departments, and teams.
Organizational chart by teams can be accessed by clicking on the team name in the department chart. Additionally, clicking on a department name will redirect you to the organizational chart of the selected department or team.
You can choose which information to display under the employee’s name by using the Settings button, where you can select the desired checkboxes. Also, you can filter the organizational chart by Teams or Print it using the button on the right side of the report.
An employee’s profile can also be opened by clicking on their name from the main organizational chart.
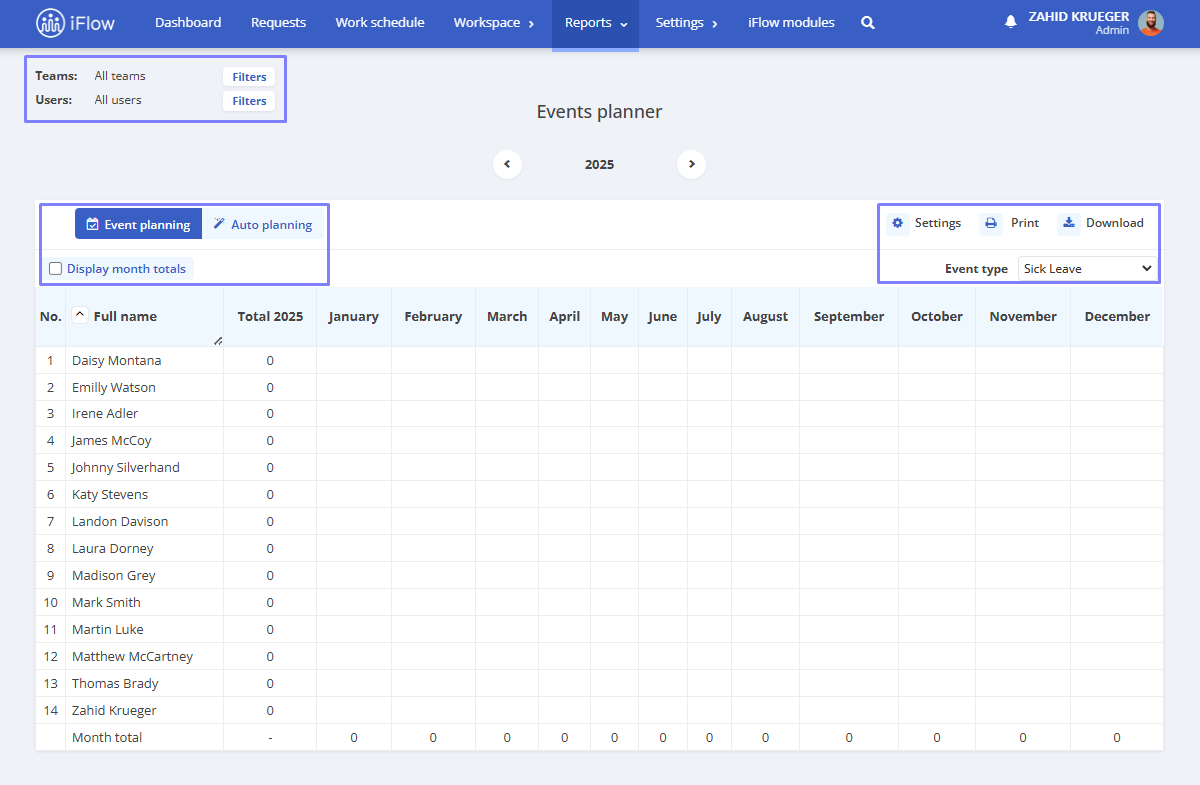
Event planner
This report provides a detailed and customized view of events, which was added separately for each year.
The report includes two filters for customization:
Teams – Allows viewing and comparing events between different teams in the organization
Employees – Provides the ability to detail events individually for each selected employee
On the right side of the report:
- Settings: Adds additional information to the report
- Print: Print the report
- Download: Download the report
- Event type: Allows you to select the type of event for which you want to generate the report
On the left side of the report:
- Event planning: Displays the actual events from the application
- Auto planning: Generates random event data automatically. Clicking on automatic planning will display a Regenerate Planning button to update the planning
- Display month totals: Displays a total for each cell for each employee for each month
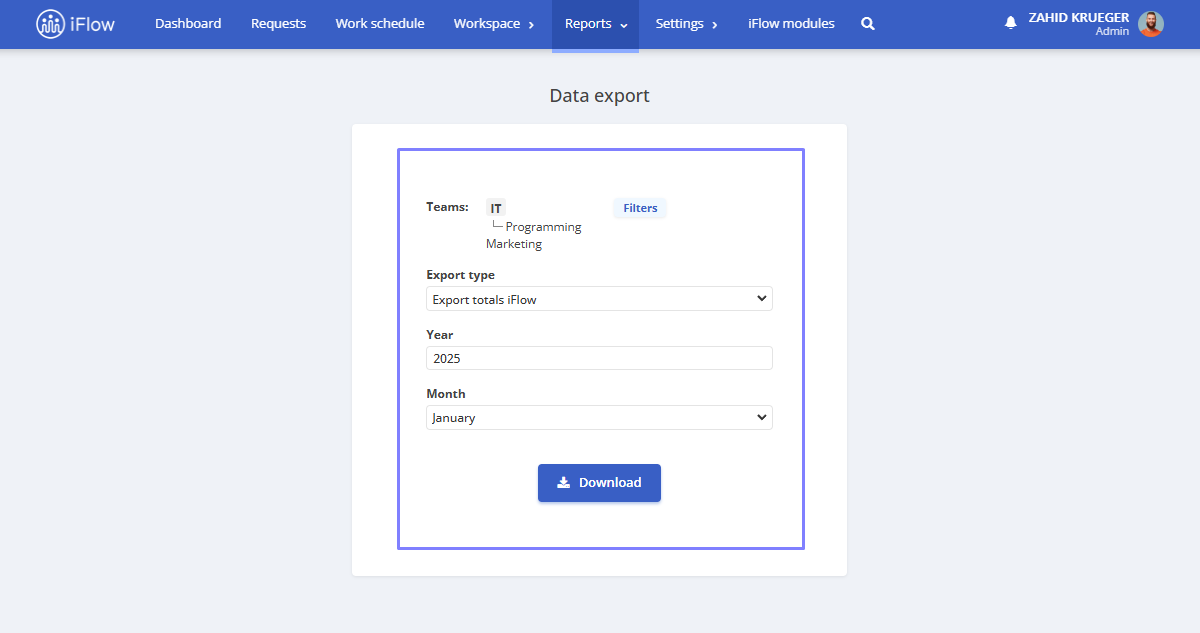
Export data
This report was created to provide companies with an efficient tool for exporting data from the application, such as an Excel table for import into payroll software.
The report includes:
- A filter to select one or more Teams
- Export type
- Year
- Month
- Download button
Attention!
These data belong to the business module. If you do not have access, please contact us at [email protected].
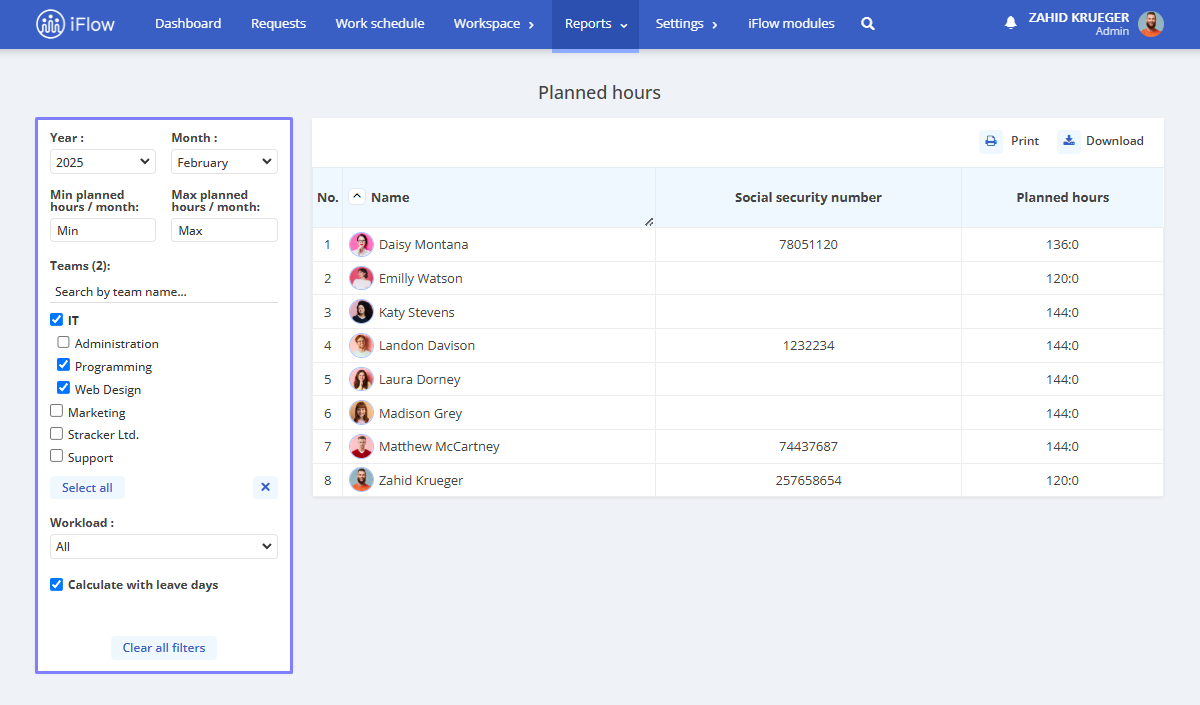
Planned hours
The Planned hours report can easily track the hours planned for each employee using the Work schedule. This report is helpful for companies whose employees work shifts, have a workload more significant than 8 hours/day, or in other cases.
The three columns in the report are:
- Name – the full name of each employee added to the application
- Social security number – if provided in the employee’s profile
- Planned hours – the total number of planned hours using the Work schedule panel
Filters for viewing the report:
- Year – select the year for which you want to check
- Month – select the month for which you want to check
- Min. planned hours/month – specify the minimum required planned hours
- Max. planned hours/month – specify the maximum required planned hours
- Teams – opens a list of all teams in the account
- Workload– can be filtered by norm
- Calculate with leave days – if checked, hours with leave days will be calculated
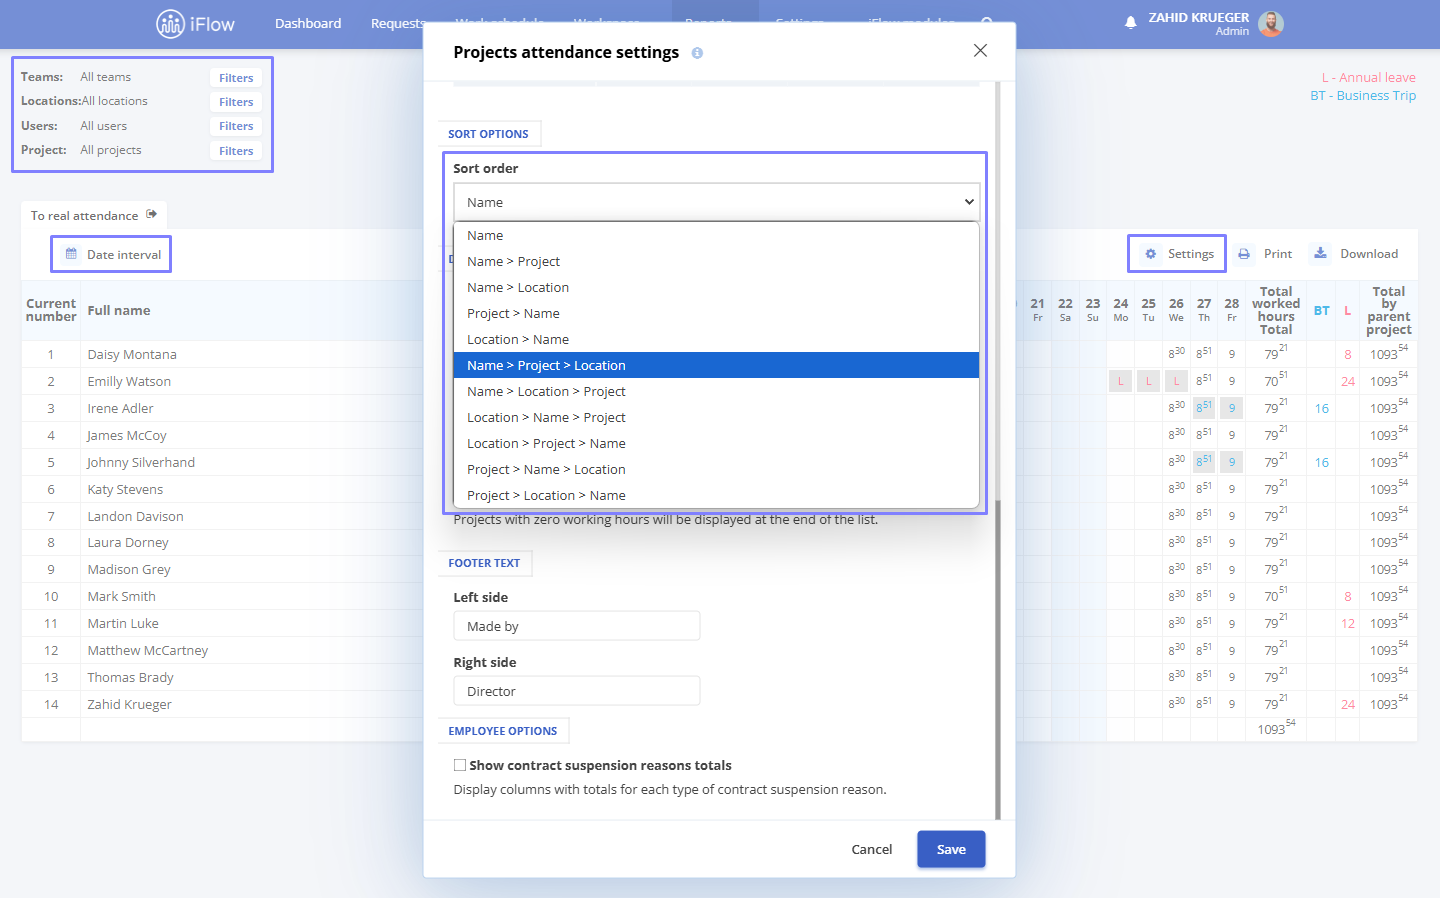
Activity overview
This report will visualize presence on projects, by employee, or by location. The report can be filtered by:
- Teams
- Locations
- Projects/subprojects
- Employees
- Date interval
Sort options:
- Name
- Name > Project
- Name > Location
- Project > Name
- Location > Name
- Name > Project > Location
- Name > Location > Project
- Location > Name > Project
- Location > Project > Name
- Project > Name > Location
- Project > Location > Name
Sort options are used to determine how the report is displayed.
Example:
If you select Project > Name > Location, the report will start with the employee’s name, followed by the projects they worked on and the location where the projects were conducted. At the end of the table, there will be two columns: total hours by name and total hours by project. The totals displayed at the end depend on the chosen sorting option.
The Activity overview report allows employees to view the work hours for each day of the month. Its purpose is to facilitate the visualization of time employees spend on specific projects or locations.
If you want to view the Attendance note added by employees, hover over the day you want to check.
Attention!
These data belong to the business module. If you do not have access, please contact us at [email protected].
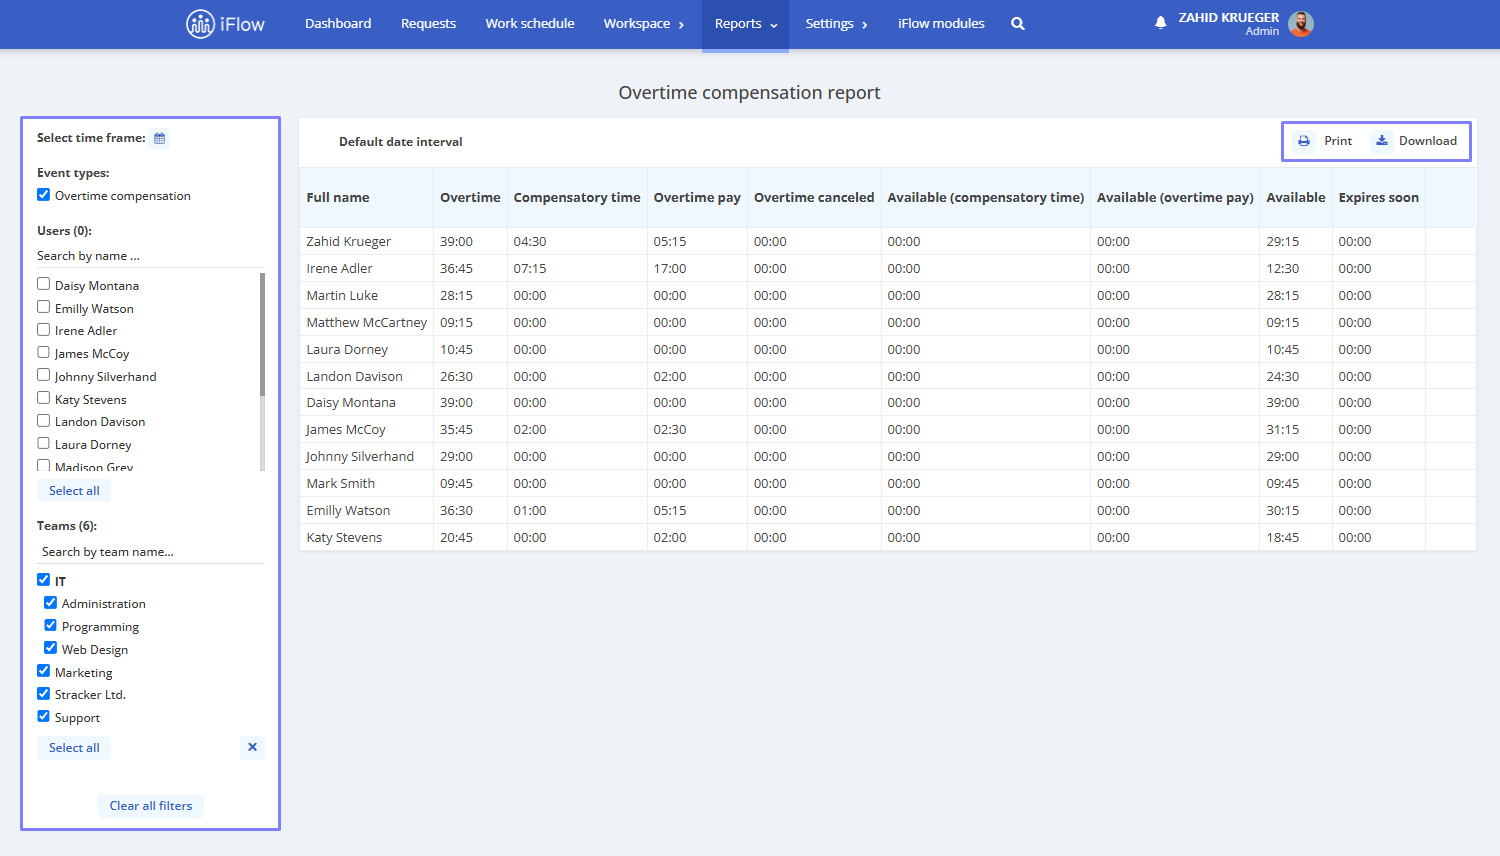
Overtime compensation
This report contains a table that displays the record of overtime hours.
It has nine predefined columns:
- Full name
- Overtime
- Compensatory time
- Overtime pay
- Overtime canceled
- Available (Compensatory time)
- Available (Overtime pay)
- Available
- Expires soon
It includes four filters:
- Select time frame
- Event types
- Users
- Teams
The report can be Printed or Downloaded in Excel format.
Attention!
These data belong to the business module. If you do not have access, please contact us at [email protected].
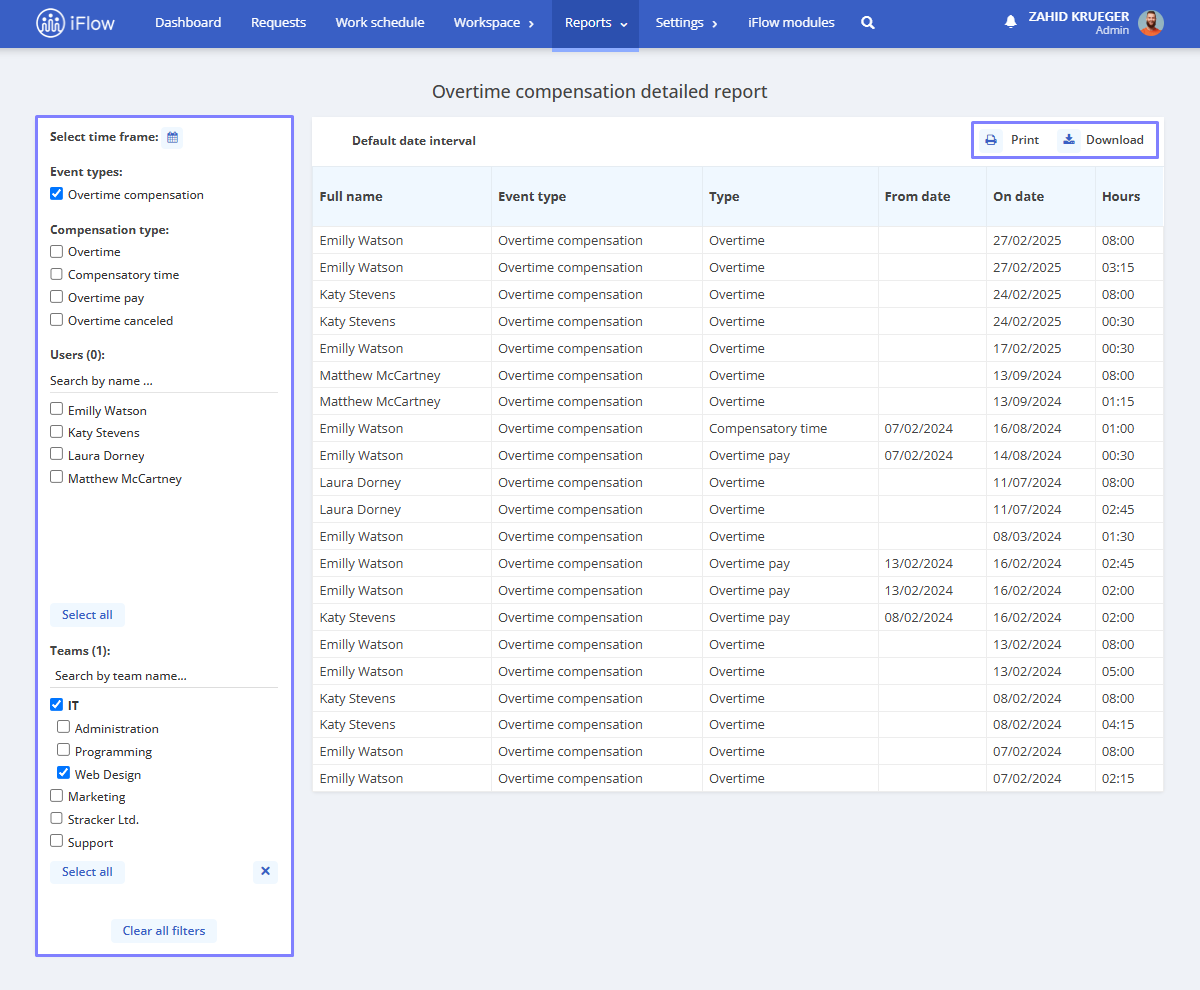
Overtime compensation detailed
This report contains a table displaying the record of overtime hours.
It has six predefined columns:
- Full name
- Event type
- Type
- From date
- On date
- Hours
It includes five filters:
- Select time frame
- Event types
- Compensation type
- Users
- Teams
The report can be Printed or Downloaded in Excel format.
Attention!
These data belong to the business module. If you do not have access, please contact us at [email protected].
Visibility permissions
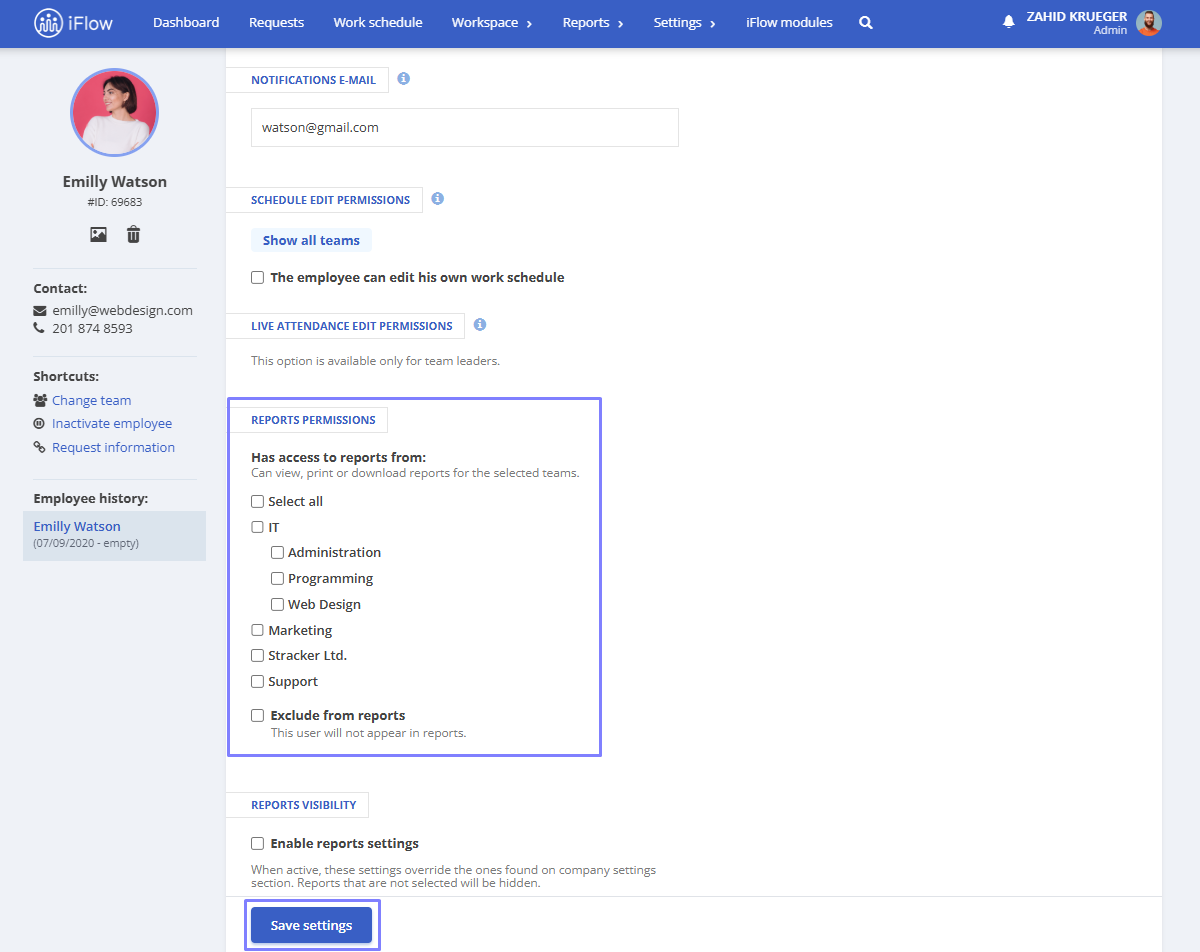
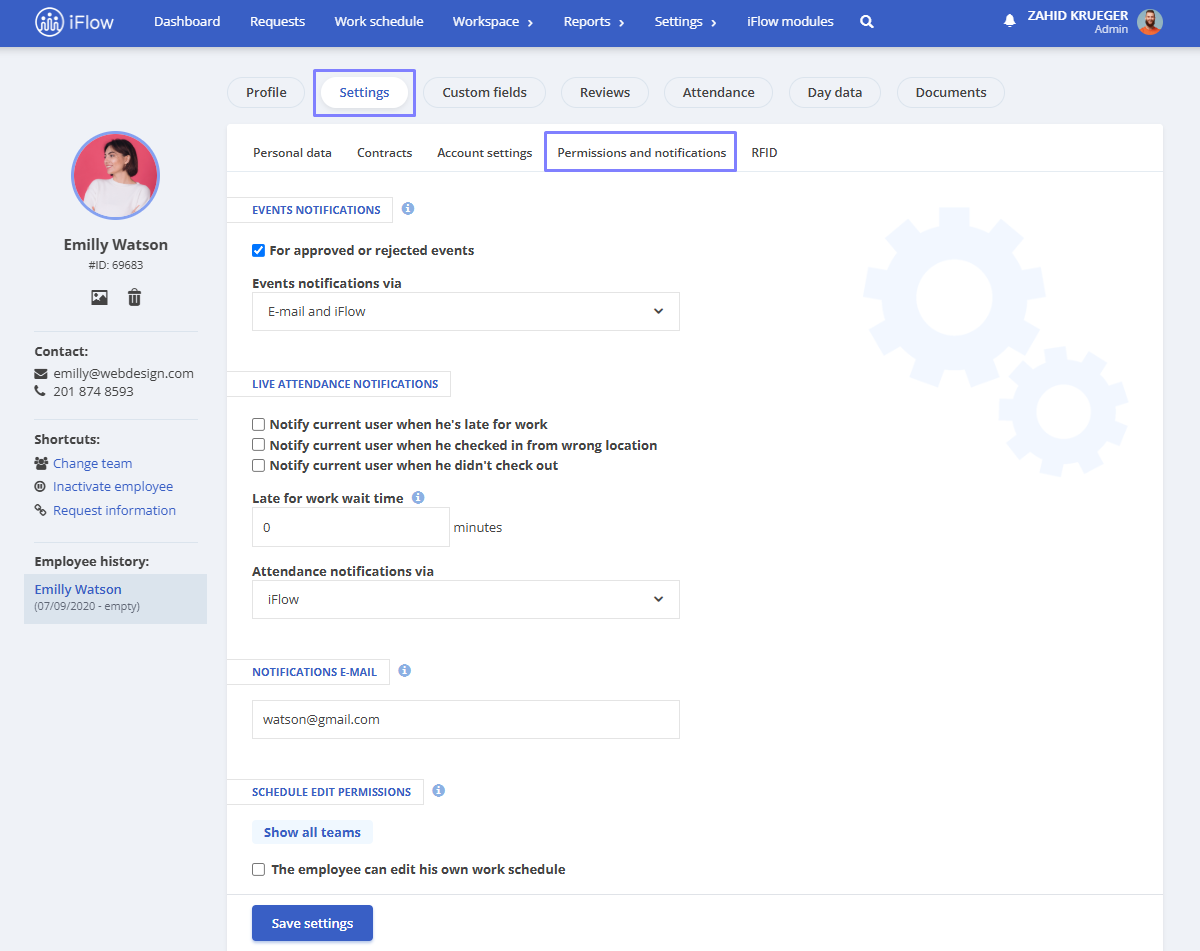
How to grant viewing permissions from the employee profile
This setting helps grant an employee viewing permissions for specific teams’ reports:
- From the employee profile, click on Settings
- Next, go to Permissions and notifications
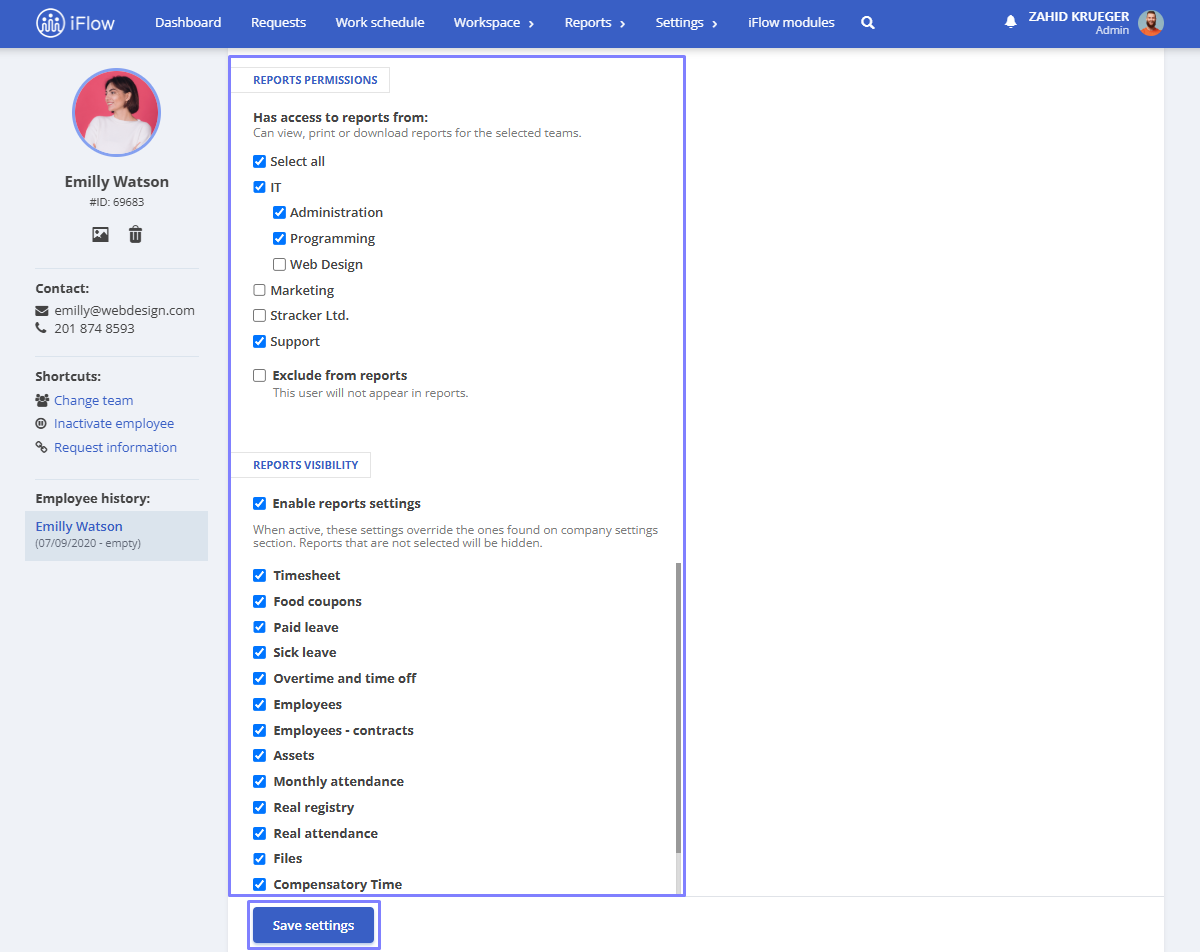
- Under the Reports permissions section, select the team/teams for which you want to display the chosen reports (if no team is selected, only the user’s account will be displayed in the report)
- In the Reports visibility section, check Enable reports settings, then select the report(s) you want to be visible to the user, such as: Timesheet, Food coupons, Paid leave, Sick leave, etc. From this section, you can also check the box if you want to grant the user access to a spreadsheet (if it is relevant to their role)
When enabled, these settings override those in the company’s Settings section. Unselected reports will be hidden.
Granting viewing permissions from company settings
This setting is practical when you want to bulk add viewing permissions for specific teams to employees:
- From the main menu, click on Settings – Company – Company settings
- In the Reports section, you will find four categories of permissions based on the application’s user types: administrators, HR team leaders, team leaders, and team members
- For each user type, select the report type you want the user to have access to, such as: Timesheet, Food coupons, Paid leave, Sick leave, etc. From this section, you can also check the box if you wish to grant the user access to a spreadsheet (if relevant to their role)
- To finalize, click Update information

To select a team for report visibility, follow these steps:
- Access the employee’s profile
- Click on Settings – Permissions and notifications
- Click on Show all teams in the Reports permissions section
- Choose the team(s) for which you want to display the selected reports (if no team is selected, only the user’s account will be visible in the report)
- Click Save settings to save