

Within a company, the organizational chart is meant to illustrate the relationships between its employees. These reports can be from administrators to employees, manager to assistant, directors from different departments, and more. For a growing firm, the organizational chart is a constantly changing structural system that reflects the setup of the company.
Given the multitude of existing types of companies, the iFlow organizational chart is specially designed to conform as accurately as possible to the structure of any company. Hierarchy is an important topic, so at any time you have quick access to information about the role of each employee and his responsibilities, to whom he is subordinated or whom he coordinates.
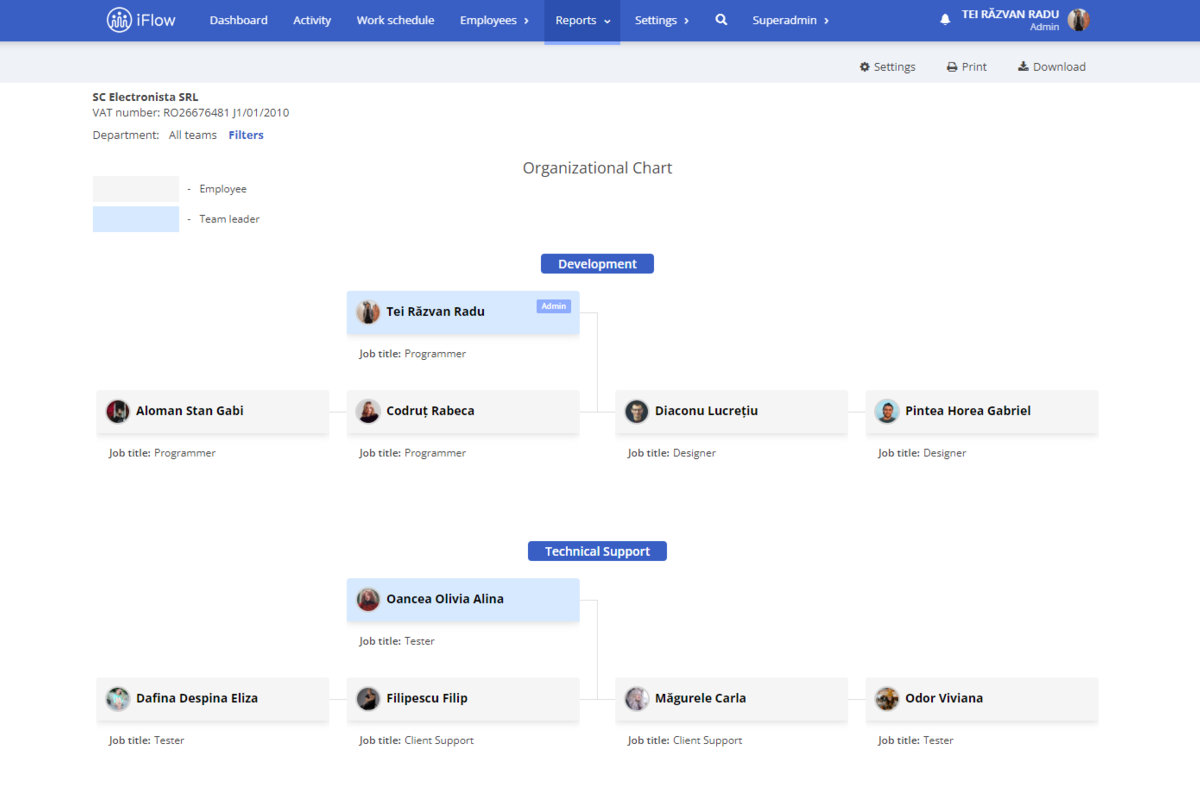
Use the organizational chart as you need:
- To display it on the company’s website
- To have an overview of departments and team leaders
- To be aware of any hierarchical changes
Read about the other news and surprises brought by the 4.7 update!


