In iFlow all the reports work based on the data that you added in the app.
Below you can find the explanations about how these reports work.
How does the Overtime and time off report work?
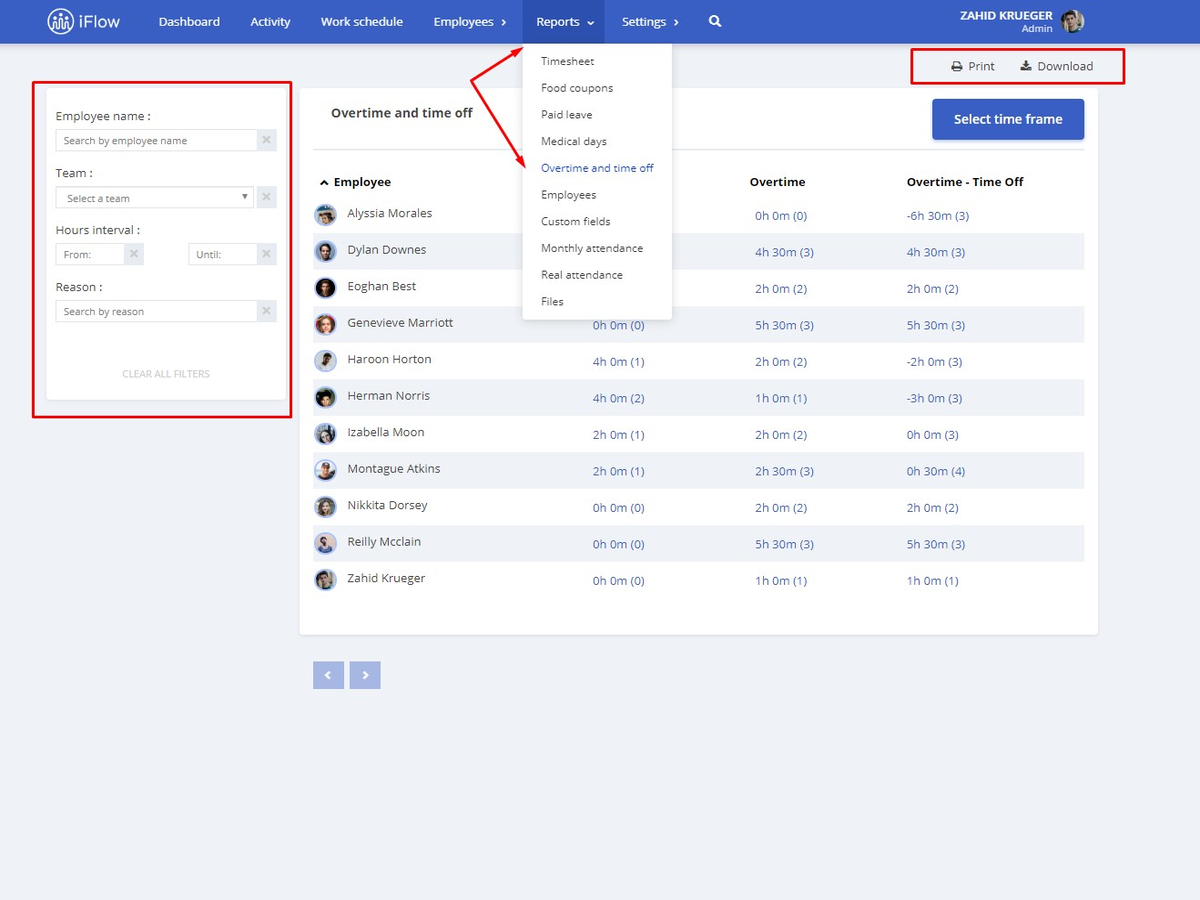
This report contains a table in which you can see how many overtime and time off hours each employee has.
- Predefined that table has 2 columns – Employee, Time off, Overtime and the difference between Overtime and Time off
- It has 5 filters: Period, Employee name, Team, Hours interval, and reason
- Each completed column has links, if you click on them, they will take you to see the events for that time off or overtime period
- The number between the parentheses represents the number of events that happened for that total of hours you are seeing
- The report can be printed or downloaded as an Excel file
How does the Employees report work?
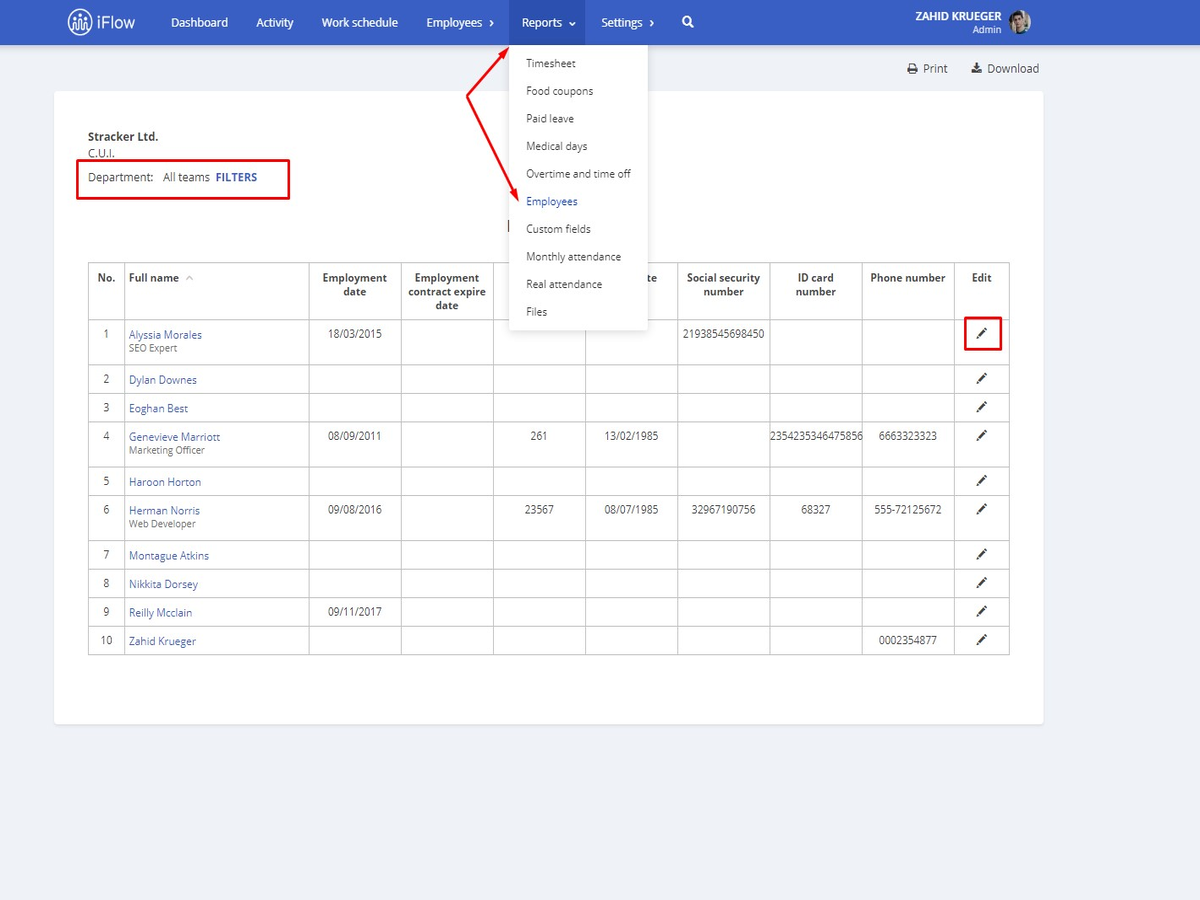
This report contains a table with the personal data of the employees, like:
- Full name and job title
- Employment date
- Employment contract expire date
- Employee contract number
- Birthdate
- Social security number
- ID card number
- Phone number
Advice! For this report to be completed, make sure that you filled all the data in the employee’s profile. Or you can do this by clicking “Edit” (directly in the report) for the employee whose data you want to edit/add.
How does the Monthly attendance report work?
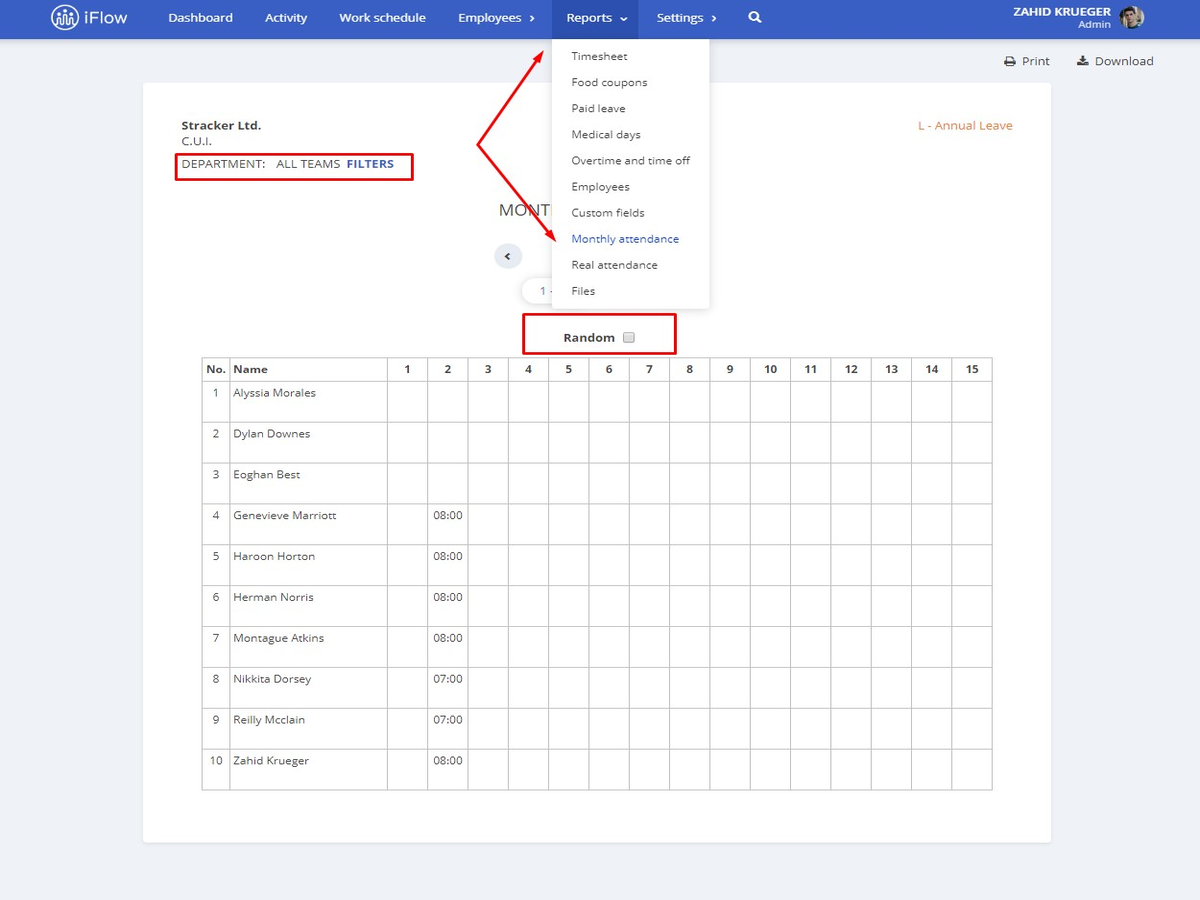
This report shows you the check-in and out time for each employee for a whole month. The days in which your employee is not at work are automatically filled.
This report takes the work schedule that you added and uses those exact hours. If you use the “Random” feature, then your attendance report will have some variations (+/- 15 minutes).
You can view this report with all the employees or filtered by teams.
Keywords: overtime hours, extra hours, time off


